Capturing Opportunity and Managing Risk in an AI-Driven Market
Key Observations
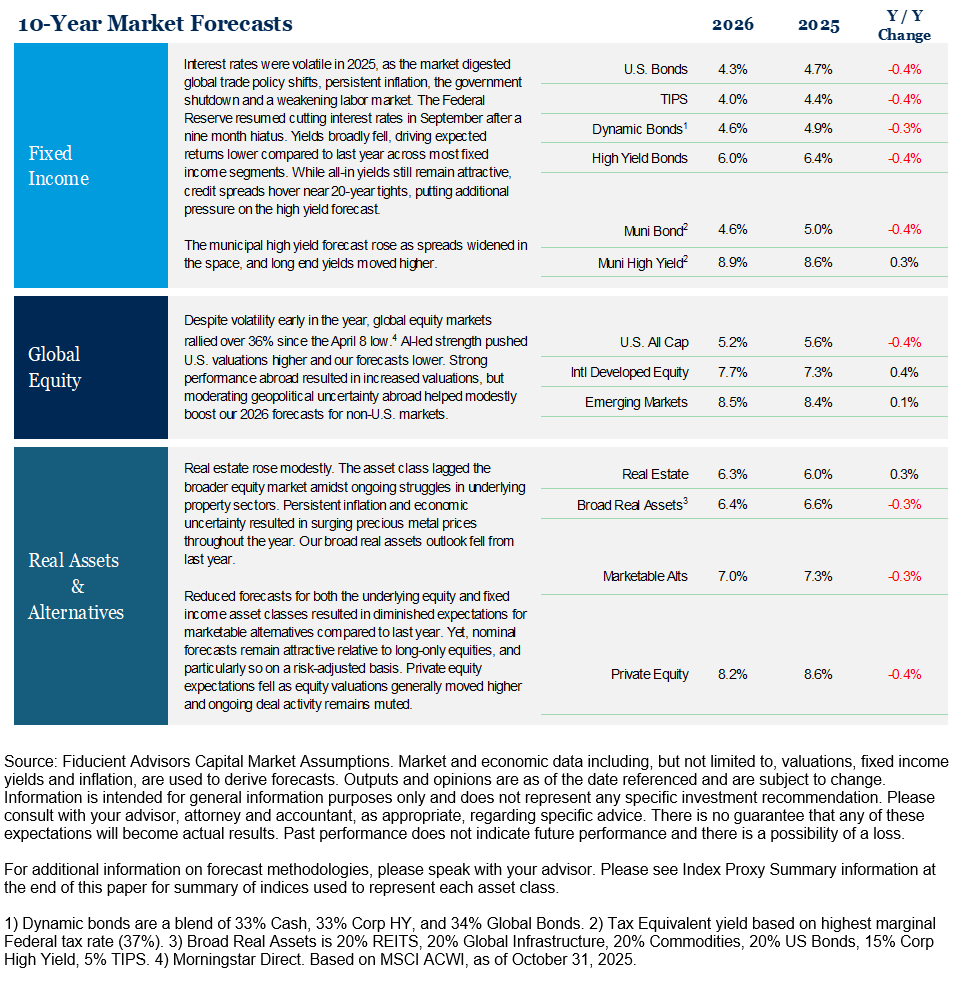
• Our 2026 Capital Market Assumptions point to a tempered outlook as higher valuations and softer yields reduce return potential.
• Artificial intelligence (AI) is already woven deeply into equity markets, making exposure management essential. Our playbook calls for measured positioning and disciplined risk sizing to capture opportunity while avoiding excess.
• Elevated valuations shape our positioning. We favor high quality fixed income for risk-adjusted returns, select global equity opportunities and alternatives to help manage volatility without overhauling portfolios.
• The year ahead will likely bring gradual shifts rather than sweeping change. With strong foundations in place, most portfolios need only modest adjustments, underscoring a timeless principle that sometimes, no action is the best action.
As 2025 draws to a close, the year stands out for defining moments that sought to reshape markets and the global economy. From rapid policy shifts on Liberation Day to the return to rate cuts by the U.S. Federal Reserve and renewed hopes for peace in Europe and the Middle East, the past 12 months have been anything but static.
Our 2025 themes, Fragility, Durability and the Age of Alpha proved highly relevant. The near-bear market in April exposed market fragility and fixed income provided ballast when trends turned negative. Bonds delivered their strongest performance in the last few years as prices adjusted to evolving macro conditions. Marketable alternatives also stood out, with some exceeding long-term equity return expectations while often taking less risk than broad equity markets. As we recast our 2026 capital market assumptions you will generally see more modest return forecasts given the increase in valuations. Below we outline several key themes that will remain central into the new year and beyond.
2026 Themes
Looking ahead to 2026, we anticipate a year shaped by subtle but meaningful shifts. Our themes serve as a playbook for navigating these changes. Current allocations provide a strong foundation, and most portfolios may require only modest adjustments. In fact, recasting our long-term assumptions reinforces the adage that sometimes, no action is the best action.
AI Playbook dives into the nuance of managing a narrow and exuberant market. We address the seemingly more frequent question: “Is AI a bubble?” and evaluate the asymmetry of potential outcomes. Is it worse to be underweight AI if it rallies or overweight if it falters? History, math and experience suggest it is better to leave some upside on the table than risk being caught in a severe downdraft. Navigating Valuation explores how to manage markets that appear richly valued and identify where green shoots of opportunity may exist. We also assess the role of alternatives in mitigating uncertainty without wholesale portfolio changes. Finally, Noise Resistance reviews economic and external factors influencing markets. While the existential weight of AI and elevated valuations present challenges, many indicators point to growth and additional stimulus ahead.
In all, we believe portfolios are well positioned thanks to the groundwork laid in 2025. With modest exceptions, such as selectively adding alternatives, portfolio adjustments will likely be limited.
AI Playbook
AI is poised to be one of the most influential forces in markets next year. Public equity markets, particularly in the U.S., are already highly concentrated in AI-related exposure. Whether you are an enthusiast or a skeptic, getting the right amount of exposure could mean the difference between success and failure. Here is our playbook for allocating in an AI-driven market without being distracted by the existential debates.
1 – Bubble? The Jury is Out
Let’s start with the b-word: “bubble.” Classic bubbles share a familiar pattern: displacement, boom, euphoria and bust. Displacement often begins with a kernel of truth and a breakthrough that is genuinely transformative. That spark fuels the boom and the exuberance that follows. History offers many examples: the invention of radio, the expansion of U.S. railroads and the fiber-optic buildout that laid the foundation for the internet, just to name a few. Each innovation changed the world, created extraordinary market opportunities and ultimately led to sharp price declines in related stocks and industries after euphoria took it too far.1
Those who believe AI is truly transformative must also seemingly cosign the notion that transformative change often carries cautionary lessons. To hold one thought without the other is to ignore history and utter the words “it is different this time”, a phrase that has accompanied every cycle of excess only to be proven wrong. So where are we in this cycle? The boom is clear: adoption, demand and massive investment in research and infrastructure. Euphoria, however, is where the real debate begins.
On one hand, some believe AI-related companies have taken a measured approach. Capital expenditures, estimated at more than $1 trillion, have been largely funded by existing cash flow of these businesses rather than debt, a sign of discipline rather than speculation. Demand also continues to outpace supply, a dynamic rarely seen in the late stages of a bubble.
On the other hand, extremes exist. Consider Thinking Machines, an AI startup founded by a former OpenAI executive. It raised $2 billion in “seed” capital at a ~$10 billion valuation, without a product and reportedly unwilling to disclose to investors what it plans to build. A month later, they went through a second round, valuing the company at $50 billion.2 Still no product. Still no revenue.
Evidence of exuberance and optimism remains, but as in all cycles, the devil is in the details. Certain pockets of the AI ecosystem will undoubtedly overreach while others will remain disciplined. No one knows precisely where we sit in this cycle, but the approach to investing through it does not change; operate with openness and curiosity, stay disciplined in risk management and never lose sight of the first principles of long-term, diversified investing. The jury is still out, and in truth, a verdict will only come long after it is too late to act. Until then, we remain grounded in practical experience and committed to disciplined risk management to navigate the current environment.
2 – The Facts: Look Inward First
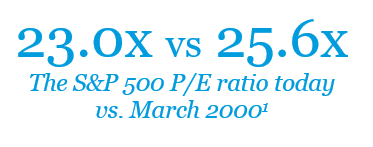
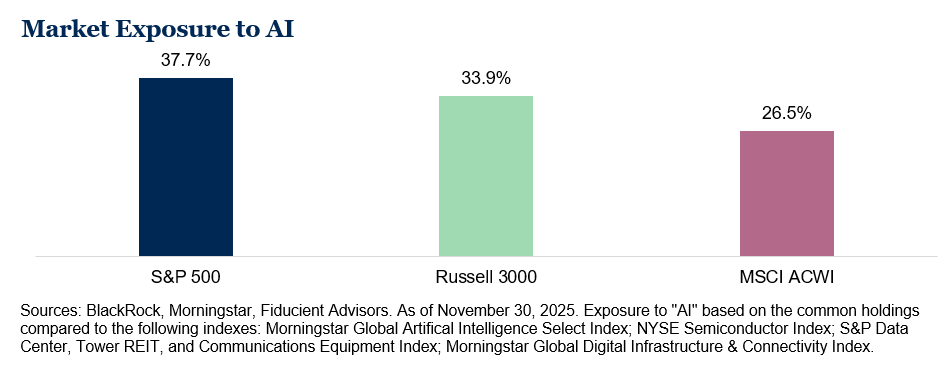
If you own U.S. equities, you have already made an AI bet, and it may be your largest. Roughly 38% of the S&P 500 is tied to companies connected to artificial intelligence.3 For perspective, ahead of the Global Financial Crisis, financials were the largest sector, representing about 20% of the index. In 2000, technology peaked at 34%.4 This does not mean AI is a bubble, but it does showcase the market’s enthusiasm for transformative technologies. So before asking how to “get into AI,” recognize that in many ways, you may already be there.
3 – Offense: The AI Flywheel
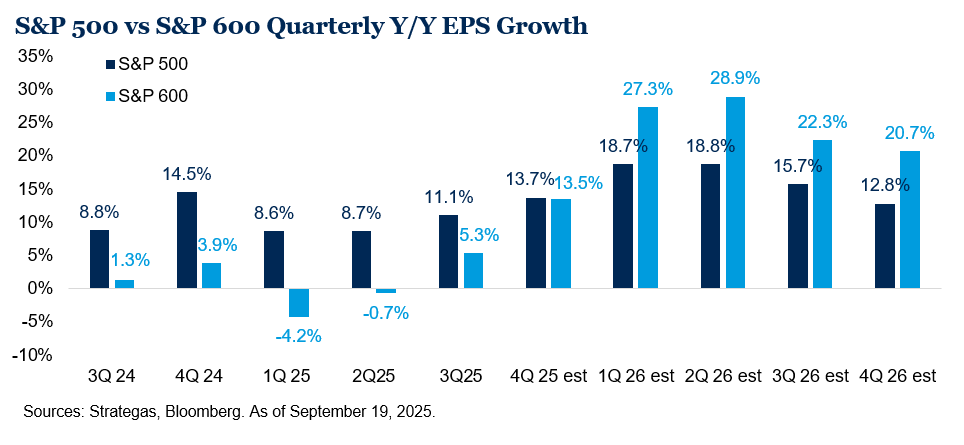
If AI proves to be as transformative as some expect, the benefits may not be evenly distributed. Companies with lower margins and sectors with lighter capital expenditure requirements, particularly service-oriented businesses, may see disproportionate gains. Mid-cap and small-cap could also present opportunities relative to large-cap U.S. stocks, given their exposure to businesses positioned to capture AI-driven efficiencies. That optimism has begun to work its way into earnings expectations and may provide newly found footing for securities outside of the “Magnificent 7.” Identifying these dynamics will be key to capturing upside beyond the obvious names.
4 – Defense: Finding the Right Balance
With the facts in hand, sizing risk becomes critical. The top 10 stocks in the MSCI ACWI now account for roughly 25% of the index, nearly triple their share a decade ago.5 Our 2026 global equity allocations show top 10 exposure near 18%, above that of the ACWI historical norm of about 14%, yet far more risk-conscious than today’s market.5 Why does this matter? Because owning too little and watching AI soar is a better outcome than owning too much and suffering if AI falters. Our analysis shows that capturing some upside is preferable to risking a severe drawdown from overexposure.
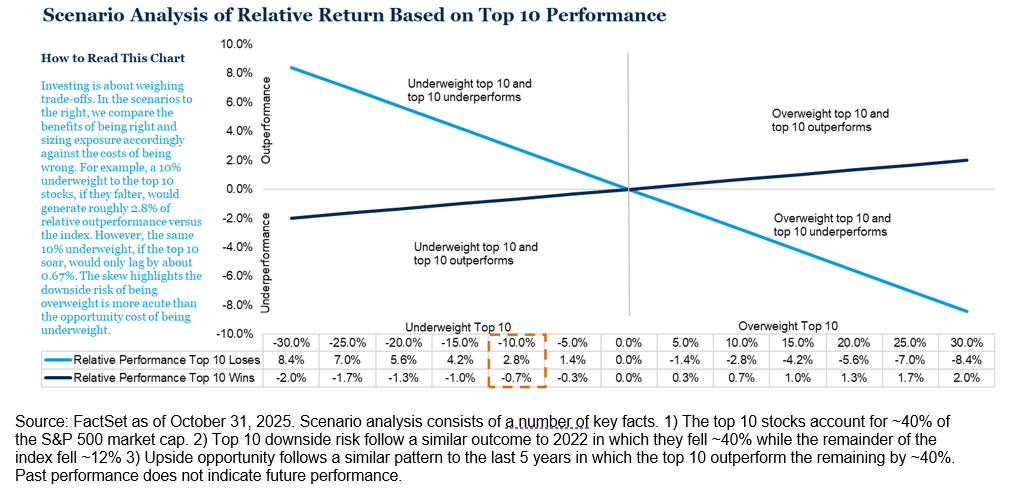
Portfolio Impact: Famed investor Howard Marks, who recently wrote on the topic of an AI bubble, stated this: “Since no one can say definitively whether this is a bubble, I’d advise that no one should go all-in without acknowledging that they face the risk of ruin if things go badly. But by the same token, no one should stay all-out and risk missing out on one of the great technological steps forward. A moderate position, applied with selectivity and prudence, seems like the best approach.”
AI is already embedded in portfolios, and in a meaningful way. Yet our approach holistically emphasizes measured exposure, thoughtful diversification and a focus on sectors positioned to benefit from AI’s real-world adoption. We are maintaining our overweight exposure to mid-cap and small-cap stocks and our modest overweight to non-U.S. equity. Both stand to benefit from a broadening of AI and should help mitigate downside risk if enthusiasm slows.
Navigating Valuation
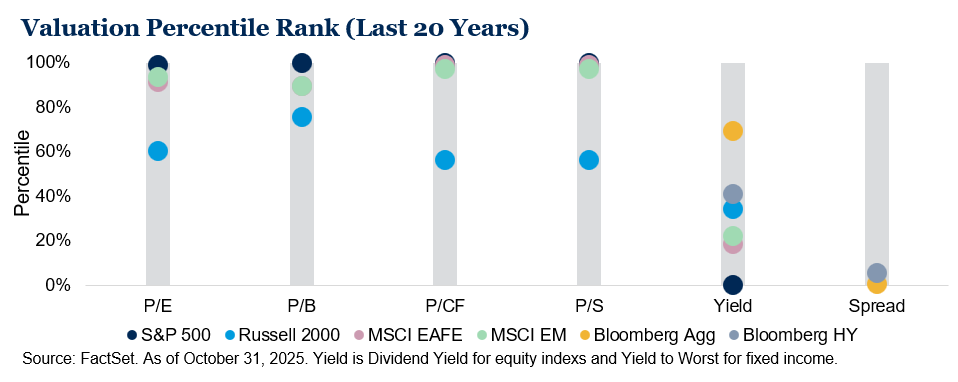
While the sun seemingly rises and sets on AI, there is still everything else, and everything else outside of AI does not make it particularly easy. Across a wide range of metrics, valuations look full relative to history. Over the last 20 years, most markets are trading near historically full valuations. Credit spreads, the extra yield awarded to investors for taking on credit risk, are low, even as overall fixed income yields remain compelling. In the short term, that may mean very little, but over the long term, it matters. Navigating periods of elevated valuations requires nuance and clear alignment with risk tolerances and portfolio objectives.
As we recast our 10-year forecasts, the “cost” of full valuations comes into view. Our prospective median return for U.S. equity hovers just above 5% (before inflation), ranking near the low end of our historical forecasts. While lower forecasts may not excite, nuance matters. Opportunities exist across global markets.
Fixed income remains compelling on both an absolute basis (attractive yields) and a risk adjusted basis (relative to the outlook for public equity). Publicly listed real estate also looks more appealing after a modest showing last year. Supported by falling rates, REITs often behave like fixed income in rate-cutting cycles. Power infrastructure and other real assets may also benefit if AI-driven demand for computing capacity continues to accelerate.
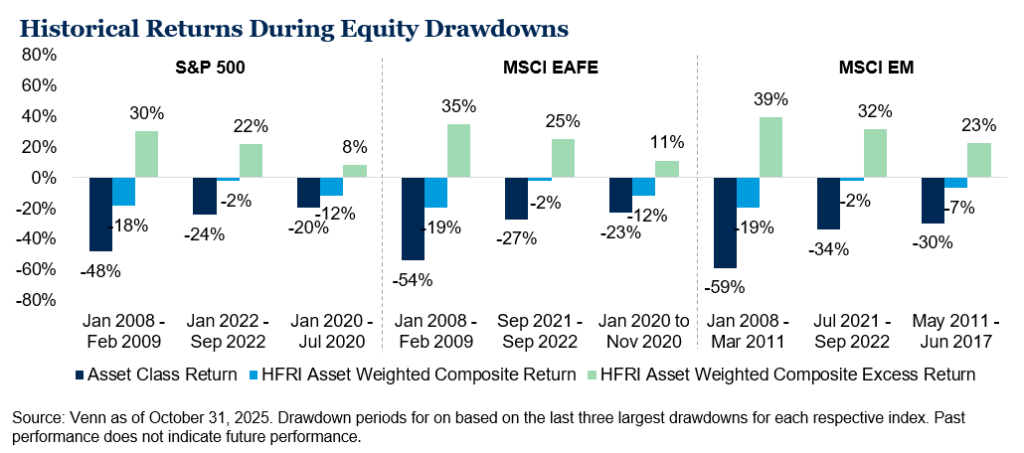
Finally, marketable alternatives, whose value tends to accrue disproportionately during volatile periods, are positioned to help investors navigate full valuations without taking drastic measures. Our forward-looking return assumption for marketable alternatives stands at 7.0% compared to global stocks at 6.5% (MSCI ACWI). If markets continue their ascent, the asset class may underperform on an absolute basis, but with a modest opportunity cost. However, should volatility rise, they may prove accretive and provide downside protection.
Portfolio Impact: Valuations are important over the long-term, and help determine what level of risk is warranted given objectives and tolerance. Even in a rich environment, opportunity persists. Fixed income offers risk-adjusted appeal with attractive all-in yields despite tight credit spreads. Marketable alternatives may offer upside capture should markets continue their upward path while reducing downside risk in a narrow and fully valued market. While alternatives may not be suitable for all based on liquidity or complexity, we believe clients without exposure should consider an allocation, and those already invested should review the potential benefits of an increased position.
Noise Resistance
Investors digested a steady stream of headlines this year: tariffs and Liberation Day in the spring, the passing of the “One Big Beautiful Bill,” the Federal Reserve resuming rate cuts after a nine-month pause and an autumn government shutdown that delayed key economic data. Despite the noise and uncertainty, the economy continues to grow, consumers continue to spend and the corporate backdrop remains healthy.
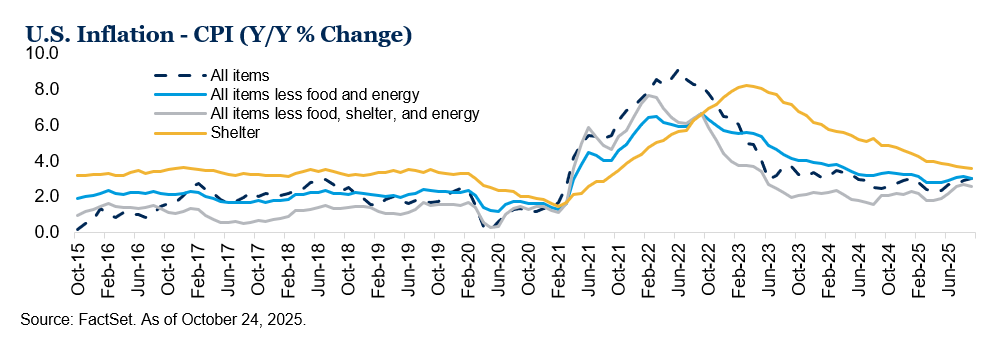
Tariffs dominated the conversation early in the year, starting with threats and uncertainty before settling near an average level of ~17%.6 While near-term inflation pressure is expected, the longer-term view remains anchored. Inflation has eased from post-pandemic highs but still sits above the Fed’s 2% target. Shelter costs have been moderating, yet many components of CPI remain above 3%. We believe inflation may ultimately move lower, but the path is likely to be uneven.
The labor market showed cracks as the year progressed, with downward revisions in the summer and shutdown-related disruptions. Job growth remains muted, and unemployment has edged up to 4.6%.7 This set the stage for the Fed to resume rate cuts in September after a nine-month pause. One cut each in October and December, respectively, left the target rate at 3.50%-3.75%. The government shutdown delayed critical data releases, fueling volatility around the December decision and more uncertainty for 2026 rate expectations, but markets continue to price in additional accommodation next year. Debate over Fed independence and Powell’s successor has added noise and will only increase in the months to come, but market data should remain the key driver of FOMC decisions.
Despite layoff headlines grabbing attention from firms like Meta, the overall employment picture remains stable and the consumer remains resilient. Early data suggest consumers spent nearly $12 billion on Black Friday, a ~9% increase from 2024.8 Additional stimulus from the “One Big Beautiful Bill” tax cuts, which are estimated to be $150 billion in tax refunds for 20269 and a central bank that is more accommodative lay the groundwork for economic acceleration.
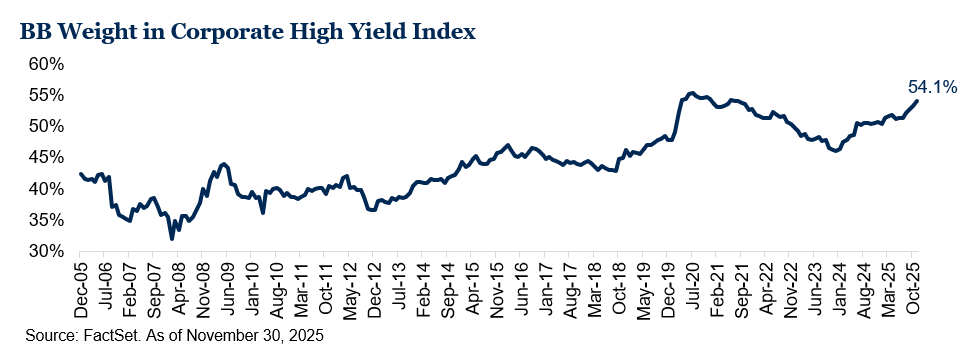
Credit was a standout in 2025. High yield bonds returned 8% year-to-date through November, supported by strong risk appetite and demand for yield, which sits near 6.6%.10 While spreads hover near 20-year lows, corporate fundamentals and an increase in the credit quality of the index broadly temper concern. This lower cost of lending bodes well for economic expansion, but as allocators we continue to exercise caution given current valuations.
Portfolio Impact: The prospects for growth heading into 2026 are positive, but signs of moderation and uncertainty in the market persist. Positioning portfolios for multiple outcomes, rather than a single scenario, remains prudent. While all-in yields in non-investment grade remain high enough to compel an allocation, similar to last year we remain tempered in our sizing. With current spreads near all-time lows and credit risk seemingly absent, our emphasis remains on high quality investment grade fixed income. Additionally, we continue to believe select active management strategies have the ability to generate alpha in this market. Dynamic fixed income and alternatives like private markets and hedge funds offer flexibility to navigate sector divergences, capture market opportunities, uncover mispriced assets and manage risk effectively.
Final Thoughts
We approach 2026 with both optimism and realism. Continued stimulus from a more accommodative Federal Reserve, the “One Big Beautiful Bill” and a resilient economy provide a strong foundation for the transformative changes driven by AI, and, by extension, the markets. That said, we recognize that current valuations and pockets of exuberance around innovation introduce risks.
As we weigh the possibilities ahead, we remain mindful of our entrusted role with clients. Ultimately, we are stewards of capital, and it is our duty to protect capital and not speculate with assets that have been placed in our care. After recasting our capital market assumptions and reviewing portfolio exposures, we find little need for material shifts. While modest adjustments may be warranted, and more substantive discussions around adding alternatives may arise, we believe current positioning reflects both balanced risks and upside potential.
1 FactSet. As of October 31, 2025.
2 Reuters. November 13, 2025.
3 BlackRock, Morningstar, Fiducient Advisors. As of November 30, 2025.
4 Morningstar. As of November 30, 2025.
5 Morningstar, Fiducient Advisors. As of November 30, 2025. See disclosures for global equity allocation definition.
6 Tax Policy Center. As of December 11, 2025.
7 BLS. As of December 16, 2025.
8 Black Friday Statistics. As of December 2, 2025. https://statistics.blackfriday/
9 Strategas. As of December 9, 2025.
10 FactSet. As of November 30, 2025.
Disclosures and Index Proxies
This report does not represent a specific investment recommendation. Comparisons to any indices referenced herein are for illustrative purposes only and are not meant to imply that actual returns or volatility will be similar to the indices. Indices cannot be invested in directly. Unmanaged index returns assume reinvestment of any and all distributions and are reported gross of any fees and expenses. Any forecasts represent future expectations and actual returns; volatilities and correlations will differ from forecasts.
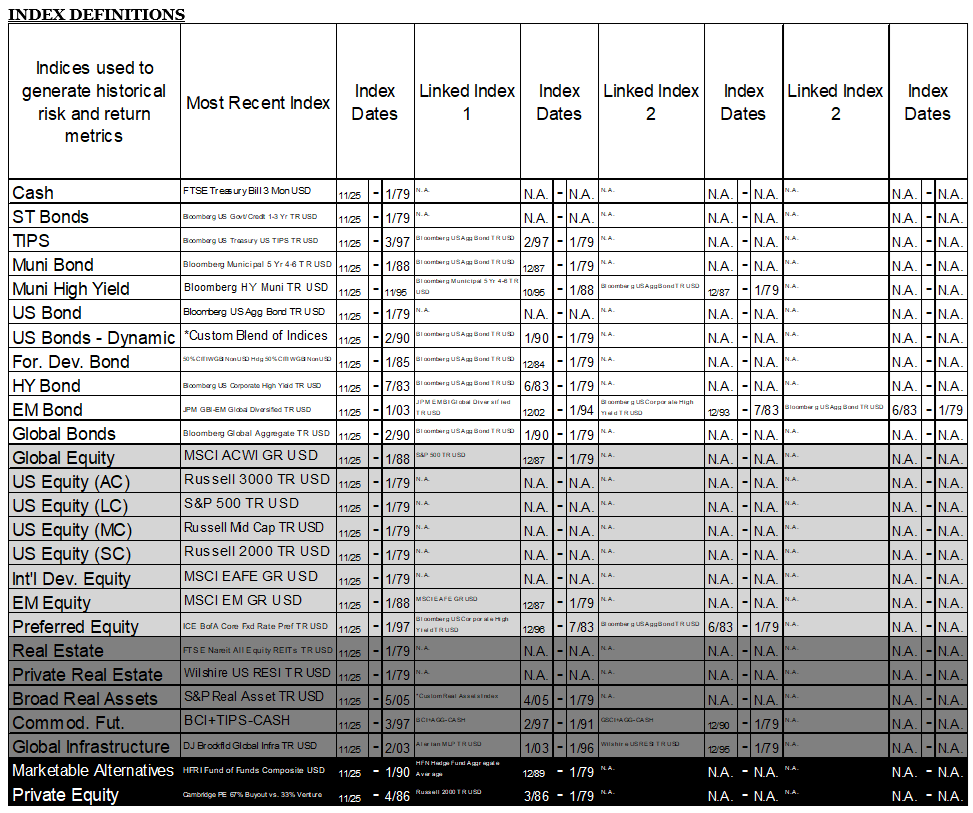
When referencing asset class returns or statistics, the following indices are used to represent those asset classes, unless otherwise notes. Each index is unmanaged, and investors can not actually invest directly into an index:
“Finding the Right Balance” global equity allocation top 10 weights based on the following weighted average portfolio of indexes: S&P 500 (41.8%), Russell Mid Cap (12.5%), Russell 2000 (8.2%), MSCI EAFE (26.1%) and MSCI EM (11.5%).
* US Bonds – Dynamic Index – 1/3 Bloomberg Gbl Agg EXUSD TR Hdg USD, 1/3 FTSE Treasury Bill Mon USD & 1/3 Bloomberg US Corporate High Yield TR USD
FTSE Treasury Bill 3 Month measures return equivalents of yield averages and are not marked to market. It is an average of the last three three-month Treasury bill month-end rates.
Bloomberg Capital US Treasury Inflation Protected Securities Index consists of Inflation-Protection securities issued by the U.S. Treasury.
Bloomberg Muni 5 Year Index is the 5 year (4-6) component of the Municipal Bond index.
Bloomberg High Yield Municipal Bond Index covers the universe of fixed rate, non-investment grade debt.
Bloomberg U.S. Aggregate Index covers the U.S. investment grade fixed rate bond market, with index components for government and corporate securities, mortgage pass-through securities, and asset-backed securities.
FTSE World Government Bond Index (WGBI) (Unhedged) provides a broad benchmark for the global sovereign fixed income market by measuring the performance of fixed-rate, local currency, investment-grade sovereign debt from over 20 countries,
FTSE World Government Bond Index (WGBI) (Hedged) is designed to represent the FTSE WGBI without the impact of local currency exchange rate fluctuations.
Bloomberg US Corporate High Yield TR USD covers the universe of fixed rate, non-investment grade debt. Eurobonds and debt issues from countries designated as emerging markets (sovereign rating of Baa1/BBB+/BBB+ and below using the middle of Moody’s, S&P, and Fitch) are excluded, but Canadian and global bonds (SEC registered) of issuers in non-EMG countries are included.
JP Morgan Government Bond Index-Emerging Market Index (GBI-EMI) is a comprehensive, global local emerging markets index, and consists of regularly traded, liquid fixed-rate, domestic currency government bonds to which international investors can gain exposure.
JPMorgan EMBI Global Diversified is an unmanaged, market-capitalization weighted, total-return index tracking the traded market for U.S.-dollar-denominated Brady bonds, Eurobonds, traded loans, and local market debt instruments issued by sovereign and quasi-sovereign entities.
MSCI ACWI is designed to represent performance of the full opportunity set of large- and mid-cap stocks across multiple developed and emerging markets, including cross-market tax incentives.
S&P 500 is a capitalization-weighted index designed to measure performance of the broad domestic economy through changes in the aggregate market value of 500 stocks representing all major industries.
S&P 600 measures the performance of 600 small-cap companies in the U.S. equity market. It is comprised of the smallest 600 companies in the S&P Composite 1500 Index. It is a float-adjusted market-capitalization weighted index.
Russell 3000 is a market-cap-weighted index which consists of roughly 3,000 of the largest companies in the U.S. as determined by market capitalization. It represents nearly 98% of the investable U.S. equity market.
Russell Mid Cap measures the performance of the 800 smallest companies in the Russell 1000 Index.
Russell 2000 consists of the 2,000 smallest U.S. companies in the Russell 3000 index.
MSCI EAFE is an equity index which captures large and mid-cap representation across Developed Markets countries around the world, excluding the US and Canada. The index covers approximately 85% of the free float-adjusted market capitalization in each country.
MSCI Emerging Markets captures large and mid-cap representation across Emerging Markets countries. The index covers approximately 85% of the free-float adjusted market capitalization in each country
The Wilshire US Real Estate Securities Index (Wilshire US RESI) is comprised of publicly-traded real estate equity securities and designed to offer a market-based index that is more reflective of real estate held by pension funds.
Alerian MLP Index is a float adjusted, capitalization-weighted index, whose constituents represent approximately 85% of total float-adjusted market capitalization, is disseminated real-time on a price-return basis (AMZ) and on a total-return basis.
Bloomberg Commodity Index (BCI) is calculated on an excess return basis and reflects commodity futures price movements. The index rebalances annually weighted 2/3 by trading volume and 1/3 by world production and weight-caps are applied at the commodity, sector and group level for diversification.
Treasury Inflation-Protected Securities (TIPS) are Treasury bonds that are indexed to inflation to protect investors from the negative effects of rising prices. The principal value of TIPS rises as inflation rises.
HFRI Fund of Funds Composite is an equal-weighted index consisting of over 800 constituent hedge funds, including both domestic and offshore funds.
HFRI Asset Weighted Composite Index is a global, asset-weighted index comprised of single-manager funds that report to HFR Database. Constituent funds report monthly net of all fees performance in US Dollar and have a minimum of $50 Million under management or $10 Million under management and a twelve (12) month track record of active performance. The HFRI Asset Weighted Composite Index does not include Funds of Hedge Funds. The constituent funds of the HFRI Asset Weighted Composite Index are weighted according to the AUM reported by each fund for the prior month.
Cambridge Associates U.S. Private Equity Index (67% Buyout vs. 33% Venture) is based on data compiled from more than 1,200 institutional-quality buyout, growth equity, private equity energy, and mezzanine funds formed between 1986 and 2015.
HFN Hedge Fund Aggregate Average is an equal weighted average of all hedge funds and CTA/managed futures products reporting to the HFN Database. Constituents are aggregated from each of the HFN Strategy Specific Indices.
Goldman Sachs Commodity Index (GSCI) is a broadly diversified, unleveraged, long-only composite index of commodities that measures the performance of the commodity market.
Morningstar Global Artificial Intelligence Select Index provides exposure to companies to the top 50 companies identified using research provided by Morningstar’s Equity Research team, as positioned to be at the forefront of AI innovation in areas including generative AI, AI data & infrastructure, AI software, and AI services.
NYSE Semiconductor Index is a rules-based, modified float-adjusted market capitalization-weighted Index that tracks the performance of the thirty largest U.S. listed semiconductor companies. Semiconductor companies are defined as those classified within the Semiconductors Industry of the ICE Uniform Sector Classification schema. This includes companies that either manufacture materials that have electrical conductivity (semiconductors) to be used in electronic applications or utilize LED and OLED technology. This also includes companies that provide services or equipment associated with semiconductors such as packaging and testing.
S&P Data Center, Tower REIT, and Communications Equipment Index measures the performance of developed market-domiciled, U.S.-listed companies which are involved in the ownership and management of data centers, telecommunication towers, and related equipment.
Morningstar Global Digital Infrastructure & Connectivity lndex provides exposure to the top 50 companies identified using research provided by Morningstar’s Equity Research team, as positioned to experience meaningful economic benefits as a producer of promising digital infrastructure technologies consisting of two themes: infrastructure as a service and current next-generation connectivity (5G).
Material Risks Disclosures
Fixed Income securities are subject to interest rate risks, the risk of default and liquidity risk. U.S. investors exposed to non-U.S. fixed income may also be subject to currency risk and fluctuations.
Cash may be subject to the loss of principal and over longer period of time may lose purchasing power due to inflation.
Domestic Equity can be volatile. The rise or fall in prices take place for a number of reasons including, but not limited to changes to underlying company conditions, sector or industry factors, or other macro events. These may happen quickly and unpredictably.
International Equity can be volatile. The rise or fall in prices take place for a number of reasons including, but not limited to changes to underlying company conditions, sector or industry impacts, or other macro events. These may happen quickly and unpredictably. International equity allocations may also be impact by currency and/or country specific risks which may result in lower liquidity in some markets.
Real Assets can be volatile and may include asset segments that may have greater volatility than investment in traditional equity securities. Such volatility could be influenced by a myriad of factors including, but not limited to overall market volatility, changes in interest rates, political and regulatory developments, or other exogenous events like weather or natural disaster.
Private Equity involves higher risk and is suitable only for sophisticated investors. Along with traditional equity market risks, private equity investments are also subject to higher fees, lower liquidity and the potential for leverage that may amplify volatility and/or the potential loss of capital.
Private Credit involves higher risk and is suitable only for sophisticated investors. These assets are subject to interest rate risks, the risk of default and limited liquidity. U.S. investors exposed to non-U.S. private credit may also be subject to currency risk and fluctuations.
Private Real Estate involves higher risk and is suitable only for sophisticated investors. Real estate assets can be volatile and may include unique risks to the asset class like leverage and/or industry, sector or geographical concentration. Declines in real estate value may take place for a number of reasons including, but are not limited to economic conditions, change in condition of the underlying property or defaults by the borrow.
Marketable Alternatives involves higher risk and is suitable only for sophisticated investors. Along with traditional market risks, marketable alternatives are also subject to higher fees, lower liquidity and the potential for leverage that may amplify volatility or the potential for loss of capital. Additionally, short selling involved certain risks including, but not limited to additional costs, and the potential for unlimited loss on certain short sale positions.
The information contained herein is confidential and the dissemination or distribution to any other person without the prior approval of Fiducient Advisors is strictly prohibited. Information has been obtained from sources believed to be reliable, though not independently verified. Any forecasts are hypothetical and represent future expectations and not actual return volatilities and correlations will differ from forecasts. This report does not represent a specific investment recommendation. The opinions and analysis expressed herein are based on Fiducient Advisor research and professional experience and are expressed as of the date of this report. Please consult with your advisor, attorney and accountant, as appropriate, regarding specific advice. Past performance does not indicate future performance and there is risk of loss.