Key Observations
• Hedge Funds finished 2024 with returns similar to 2023.
• High yield credit spreads remain historically tight, dampening the alpha potential of some strategies and leading others to look more into levered loans within the high yield spectrum.
• Liability management exercises are more prevalent now than at any time since data has been collected.
A Volatile Beginning
The year is off to an exciting start for marketable alternatives managers and investors. As recently as “Hedge Fund Week” held in Miami in late January, phrases such as “American exceptionalism” and “animal spirits” were used to describe capital markets that seemingly could do no wrong. But then, what felt like overnight, those same investors dusted off their old macroeconomics textbooks and flipped to the chapters on global trade policy and tariffs.
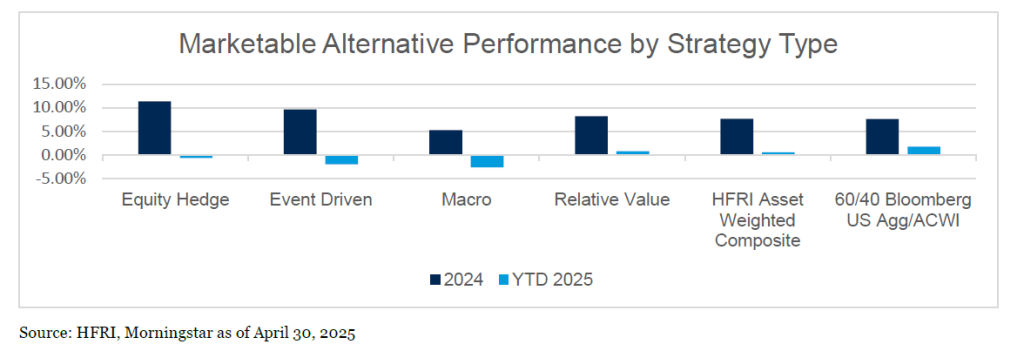
Just as securities are seeing increased dispersion, there are plenty of winners and losers year to date among marketable alternatives strategies, and managers within those strategies. Equity hedge strategies are down slightly, with many strategies doing well to protect capital the first four months of the year, while multi-strategies dragged the bucket down due to losses attributed to a broad reduction in leverage in March1.
Event Driven and Macro strategies have performed the worst year to date, down -2.0% and -2.6% respectively. March was challenging for Event Driven strategies, with Activist2 and Special Situations3 managers posting big losses. Macro managers, on the other hand, had the most difficulty in April, with Commodity4 and Systematic Diversified5 managers weighing the most on performance. Relative Value is the only strategy bucket positive year to date, returning +0.8%. Fixed Income Convertible Arbitrage6 has been the best performing, and Volatility7 the biggest laggard, with most of the other sub-strategies doing reasonably well.
Despite most of the strategy buckets being down to start the year, the Asset Weighted Composite is up +0.5%. This further illustrates the dispersion amongst managers and shows that the majority of assets are with managers that have navigated the market environment reasonably well compared to their cohorts. One marketable alternatives benchmark we use is a 60% Bloomberg US Aggregate Index and 40% MSCI ACWI, which represents an “opportunity cost of capital” for an investor choosing to allocate to marketable alternatives. The benchmark is up +1.8% YTD, outperforming all strategy buckets and the asset weighted composite. Decomposing the benchmark, we can see that the Bloomberg US Aggregate is up +3.2% to start the year, with the MSCI ACWI down -0.4%. It is a notable start to this year in global equity markets, with foreign developed markets carrying the ACWI on their backs. The MSCI EAFE has outperformed the S&P 500 by +21% from December 25, 2024 through April 21, 2025, its largest excess return in magnitude in almost 20 years.
The start of 2025 contrasts heavily with 2024, which seemed on the surface as a second tough year in a row for marketable alternatives to shine. Except for a small blip at the beginning of August with the Japanese Yen carry trade unwind, equity volatility and credit spreads remained rather low throughout the year. In strong years for equity markets, investors have a propensity to use that as a benchmark for their marketable alternatives, and 2024 marked back-to-back years of strong performances in global equities. However, when we look beneath the surface, the MSCI ACWI’s performance was heavily buoyed by US large cap equities. Foreign developed and emerging markets lagged, and the Bloomberg US Aggregate Index fell well short of cash, bringing our marketable alternatives benchmark in at only +7.6% for the year.
Within the strategy buckets, in 2024 Equity Hedge strategies were up +11.3%, only a couple basis points off their 2023 broad return, with the Quantitative Directional8 sub-strategy leading the charge and sector-focused energy and materials9 being the weakest performers. Event Driven put up +9.6%, which lagged its 2023 performance by 0.8%. Within its sub-strategies, Distressed10 and Multi-Strategy11 did well, while Merger Arbitrage12 struggled. Macro, on the other hand, had a much better year in 2024 than 2023, putting up +5.2% when it was flat the year prior. Active Trading13 was far and away the best performing sub-strategy, with Currency14 and Systematic Diversified lagging. Relative Value was the only strategy bucket in 2024 that outperformed itself from 2023, returning +8.2%. Most of its sub-strategies performed well, with Fixed Income Convertible Arbitrage leading the way, although the Volatility sub-strategy underperformed significantly. Even though most of the strategy buckets were relatively in line with 2023, the Asset Weighted Composite almost doubled its 2023 number, returning +7.6% for 2024 and edging out the Agg/ACWI benchmark.
Opportunity Set Spotlight – Credit Markets
There are several themes consistent across marketable alternatives managers trading fixed income focused strategies, with the standouts of tight credit spreads and liability management exercises.
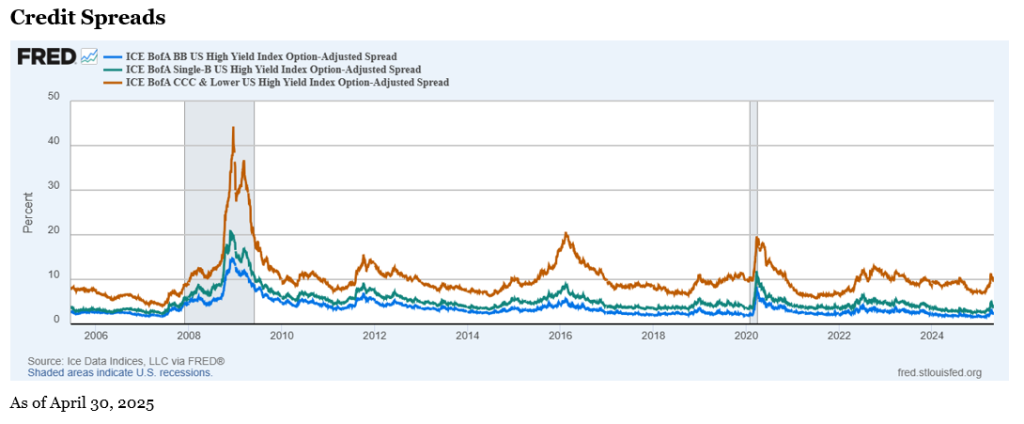
The story during 2024 was historically tight credit spreads. Much like volatility can create good opportunities for active management in equity markets, wide credit spreads can create good opportunities for credit managers, and 2024 was one of the worst calendar years on record. The tight spreads in the BB and B range of the high yield market were 40% below the historic average. Though CCC was much of the same story, the annual average was slightly closer, only 20% below the historic average, leading many managers to look to this area of the credit market for opportunities.
The first four months of 2025 have proven highly volatile in equity markets, but surprisingly credit markets have been far less affected. When the CBOE Volatility Index spiked into the 60s in the aftermath of the “Liberation Day” announcement at the beginning of April, some managers trading in credit markets described the environment as “very orderly” without much evidence of investors being forced to sell securities. Credit spreads widened as expected, but when zooming out, it was a very modest move. High yield spreads did not make it up to levels seen in 2022 and 2023 and have been steadily coming back down since their April 7 highs.
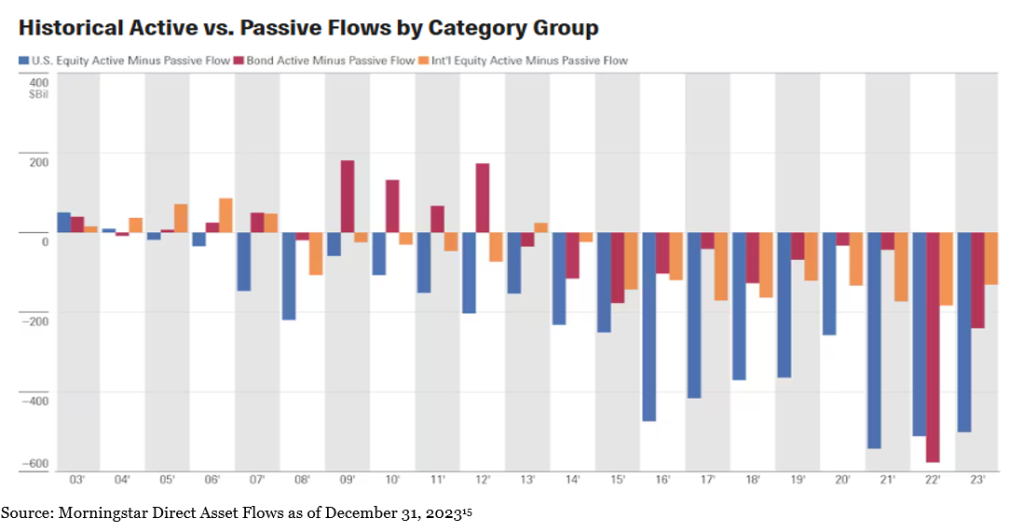
Why spreads have been so tight, and what might cause them to finally break, are tough questions to answer. In theory it is a simple supply and demand problem and bond investors are more willing to accept lower spreads for bonds now than in the past. Some have speculated that the rise of passive investing might be a strong contributor. The shift from active to passive investing has been a hot topic for quite a few years now, kicking off in earnest in equity markets in the wake of the Global Financial Crisis (GFC). Equity markets have been the focus of the conversation, as they were the first movers and account for the largest percentage of invested capital. Taking a look at fixed income markets, the balance of flows didn’t start to shift from active to passive until 2013. Fund flows remained relatively small compared to the flows in equity markets until 2022. What finally happened in 2022 that had such a large impact on fixed income markets? Inflation rose from 2-3% since the 1990s to over 8%, and interest rates on cash rose from near 0% to over 5%.
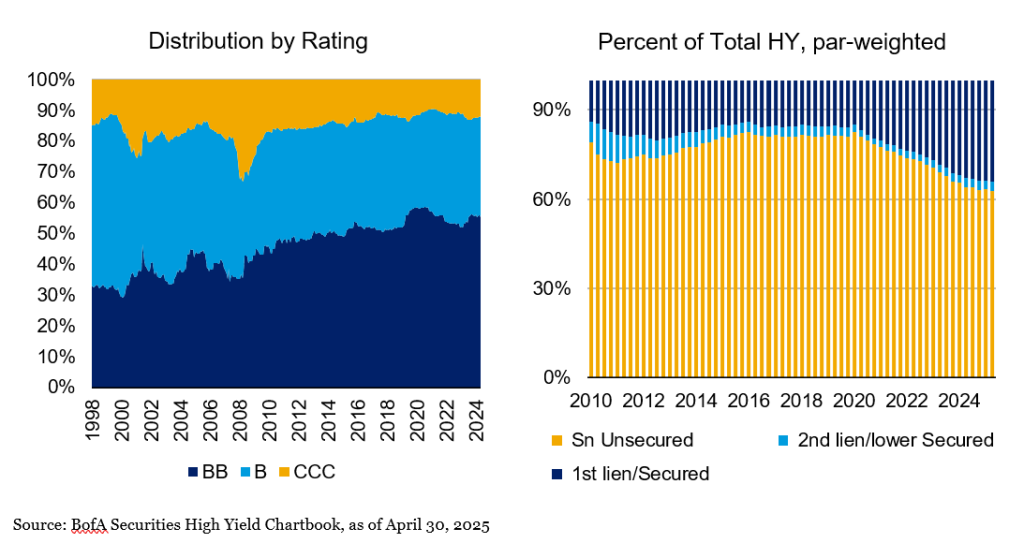
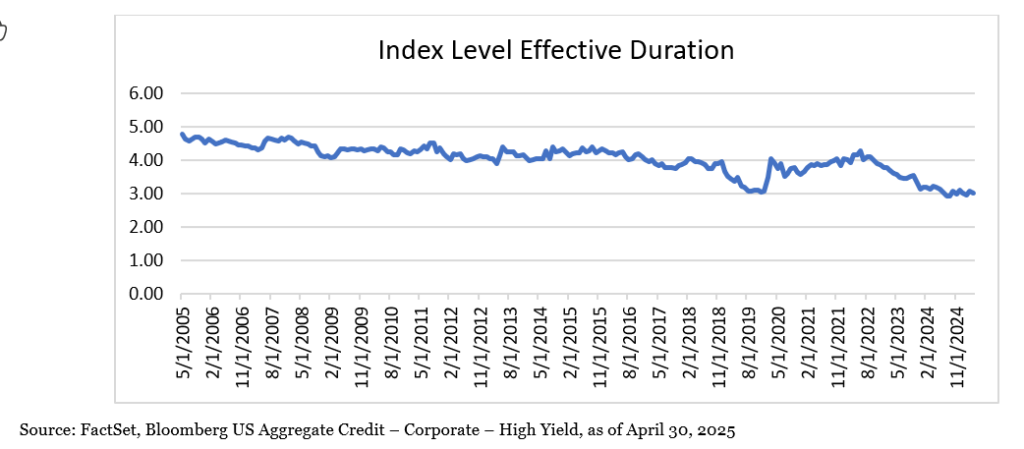
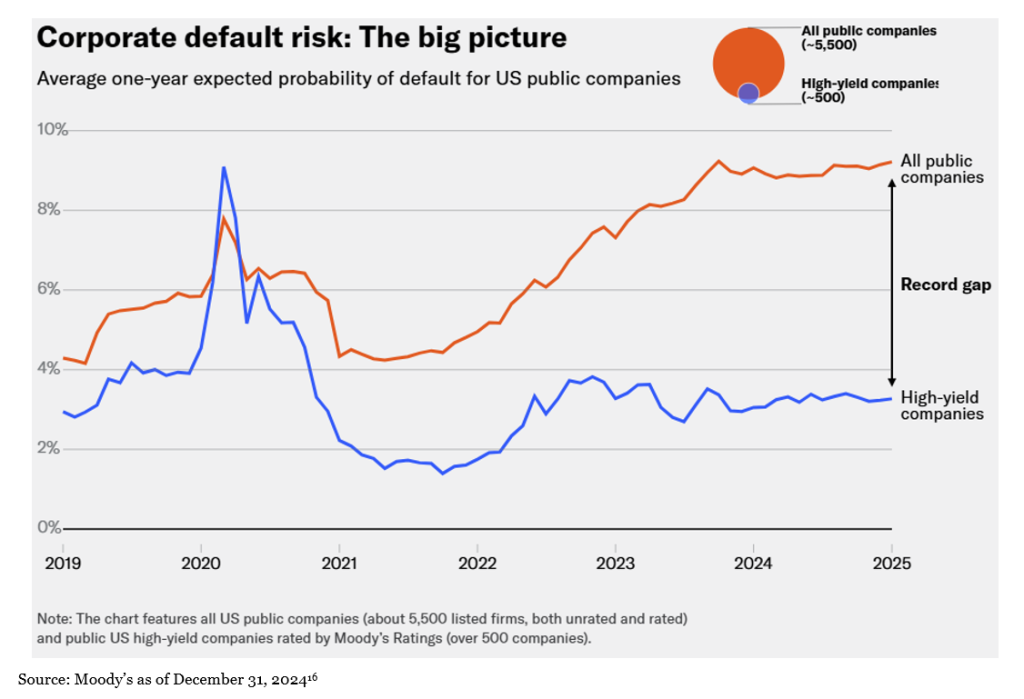
Another consideration is that some view the risks as lower than when credit spreads were more attractive. Since the GFC, the high yield index has grown higher in quality over time, with both B and CCC losing ground to BB as a percentage of the index. According to Moody’s, there is a record gap between the probability of default among all US public companies and high yield companies specifically, with all public companies at a post-GFC high, and high yield companies sitting near historic averages. The high yield market is also becoming more secure, with the percentage of 1st lien growing steadily overtime from 12% in 2010 to 33% today. The final point to note about the makeup of the high yield index is that duration has slowly crept down over the past 20 years, from 4.79 in 2005 to 3.02 today, which has a direct effect on interest rate risk.
Liability Management Exercises (LME)
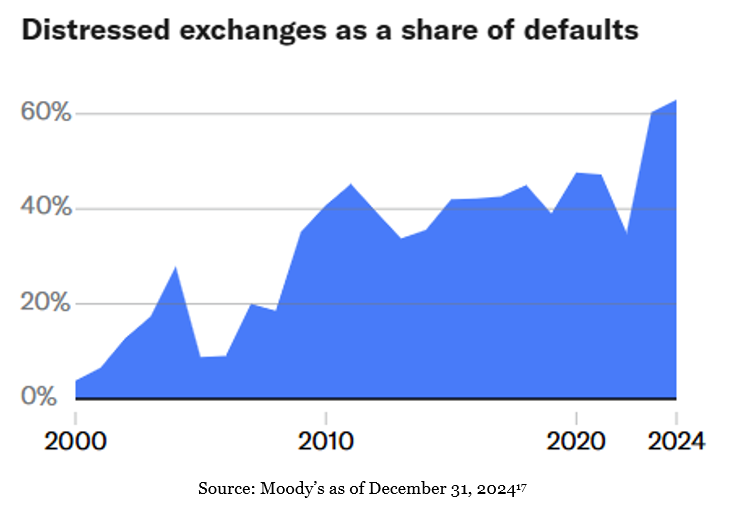
Given several different names, liability management exercises, or distressed exchanges, are terms for a large variety of methods that companies can use to stave off potential default when under stress. It is no wonder this term seemed to suddenly enter our lexicon within the last couple of years, when we look at the Moody’s data. The data show that distressed exchanges account for 63% of defaults in 2024, the highest share on record going back to the 1980s. So, what are LMEs, and where are the risks and opportunity?
Perhaps the most famous example of LME came from the retailer J. Crew in 2017. The company was facing maturity it couldn’t meet on over $500 million of Pay-In-Kind (PIK) notes but had no way to raise enough cash because almost all of the company’s assets were already pledged as collateral. In what is now known as the “J. Crew Trap Door”, the company was able to shift most of the value of its trademark to an unrestricted entity and then borrow against its value. They were then able to enter into exchanges with the holders of the PIK notes to restructure them to new senior secured notes. The company also settled the lawsuit of their LME move with term loan lenders by making a par paydown of half the value of the new debt raised. When the dust settled, the company was able to greatly reduce debt on its balance sheet and extend their runway to bankruptcy by another three years before finally having to file for Chapter 11 in 2020.
“Trap doors”, “uptiering”, “double dip” and “pari plus” are just a few among a plethora of different forms of LME. With this rise in LME has also come a rise on “creditor on creditor violence.” By participating in, or sometimes even driving these LMEs, creditors can use their position and size in the capital structure to negotiate exchanges with issuers where they come out on top and other creditors elsewhere in the cap structure are left with little or even nothing. Today’s credit investors face increased risk of LMEs from the issuers and also face increased risk driven by their fellow creditors. This risk is particularly elevated with creditors who are smaller, subordinate and/or passive within a given capital structure.
However, the current LME environment has created opportunities for some alternative investment managers as well. Larger managers who have experience with workouts are well positioned to navigate these situations, bringing other creditors into ad-hoc groups and participating in or even running the steering committees. LME in this context provides another tool in the toolbox for these managers to generate alpha for their investors. This opportunity set isn’t limited only to large managers already participating in companies looking for relief from an LME. Smaller managers with the relevant experience can find a wealth of opportunity in the right size capital structures that are too small for the larger players to invest but are facing the same financing needs and perils as their larger peers. Some managers have even taken to targeting LMEs directly as a strategy, eschewing other areas of stressed and distressed investing.
Key Takeaways on Marketable Alternatives
2024 was a tough year for marketable alternatives when measured up against US large cap equity. However, the space performed favorably when compared to a more reasonable opportunity cost-oriented benchmark. Some fixed income focused managers had a tough time with tight credit spreads. The prevalence of LMEs has created increased risk for some managers and strategies, while simultaneously creating greater opportunities for others. Many managers that employ fixed-income strategies have expressed excitement for their opportunity set as a result of more volatility.
Marketable alternatives are a useful portfolio tool that can help enhance your return profile by providing strong correlation benefits, volatility dampening and downside protection against global public and private equity. We are continuously monitoring this large market that sits between daily liquid public equities and fixed income at one end and locked-up drawdown based private equity and credit vehicles at the other end, working to understand where the opportunity set is today and how it is changing over time. To explore how marketable alternatives can support your long-term goals, contact the professionals at Fiducient Advisors and begin strategically enhancing your portfolio today.
1HFRI EH: Multi-Strategy Index, as of April 30, 2025.
2HFRI ED: Activist Index, as of April 30, 2025.
3HFRI ED: Special Situations Index, as of April 30, 2025.
4HFRI Macro: Commodity Index, as of April 30, 2025.
5HFRI Macro: Systematic Diversified Index, as of April 30, 2025.
6HFRI RV: Fixed Income-Convertible Arbitrage Index, as of April 30, 2025.
7HFRI RV: Volatility Index, as of April 30, 2025.
8HFRI EH: Quantitative Directional Index, as of April 30, 2025.
9HFRI EH: Sector – Energy/Basic Materials Index, as of April 30, 2025.
10HFRI ED: Distressed/Restructuring Index, as of April 30, 2025.
11HFRI ED: Multi-Strategy Index, as of April 30, 2025.
12HFRI ED: Merger Arbitrage Index, as of April 30, 2025.
13HFRI Macro: Active Trading Index, as of April 30, 2025.
14HFRI Macro: Currency Index, as of April 30, 2025.
15Sabban, Adam. “It’s Official: Passive Funds Overtake Active Funds.” Morningstar, Jan 17, 2024. https://www.morningstar.com/funds/recovery-us-fund-flows-was-weak-2023
16, 17Grunebaum, Dan et al. “US Corporate Default Risk in 2025.” Moody’s, March 4, 2025. https://www.moodys.com/web/en/us/insights/data-stories/us-corporate-default-risk-in-2025.html
Disclosures and Definitions
Comparisons to any indices referenced herein are for illustrative purposes only and are not meant to imply that actual returns or volatility will be similar to the indices. Indices cannot be invested in directly. Unmanaged index returns assume reinvestment of any and all distributions and do not reflect our fees or expenses. It is not possible to invest directly in a financial index. Exposure represented by an index is available through instruments based on that index.
- MSCI World captures large and mid-cap representation across 23 Developed Markets countries. With 1,645 constituents, the index covers approximately 85% of the free float-adjusted market capitalization in each country.
- Bloomberg U.S. Aggregate Index covers the U.S. investment grade fixed rate bond market, with index components for government and corporate securities, mortgage pass-through securities, and asset-backed securities.
- Bloomberg Global High Yield TR USD is a multi-currency flagship measure of the global high yield debt market. The index represents the union of the US High Yield, the Pan-European High Yield, and Emerging Markets (EM) Hard Currency High Yield Indices.
- The HFRI Asset Weighted Composite Index is a global, asset-weighted index comprised of single-manager funds that report to HFR Database. Constituent funds report monthly net of all fees performance in US Dollar and have a minimum of $50 Million under management or $10 Million under management and a twelve (12) month track record of active performance. The HFRI Asset Weighted Composite Index does not include Funds of Hedge Funds. The constituent funds of the HFRI Asset Weighted Composite Index are weighted according to the AUM reported by each fund for the prior month.
- HFRI Equity Hedge (Total) Index – Asset Weighted Index includes investment managers who maintain positions both long and short in primarily equity and equity derivative securities. A wide variety of investment processes can be employed to arrive at an investment decision, including both quantitative and fundamental techniques; strategies can be broadly diversified or narrowly focused on specific sectors and can range broadly in terms of levels of net exposure, leverage employed, holding period, concentrations of market capitalizations and valuation ranges of typical portfolios. EH managers would typically maintain at least 50% exposure to, and may in some cases be entirely invested in, equities, both long and short. The constituent funds of the HFRI Equity Hedge (Total) Index – Asset Weighted are weighted according to the AUM reported by each fund for prior month.
- HFRI Event-Driven (Total) Index – Asset Weighted Index includes Investment Managers who maintain positions in companies currently or prospectively involved in corporate transactions of a wide variety including but not limited to mergers, restructurings, financial distress, tender offers, shareholder buybacks, debt exchanges, security issuance or other capital structure adjustments. Security types can range from most senior in the capital structure to most junior or subordinated, and frequently involve additional derivative securities. Event Driven exposure includes a combination of sensitivities to equity markets, credit markets and idiosyncratic, company specific developments. Investment theses are typically predicated on fundamental characteristics (as opposed to quantitative), with the realization of the thesis predicated on a specific development exogenous to the existing capital structure. The constituent funds of the HFRI Event-Driven (Total) Index – Asset Weighted are weighted according to the AUM reported by each fund for prior month.
- HFRI Macro (Total) Index – Asset Weighted Index includes Investment Managers which trade a broad range of strategies in which the investment process is predicated on movements in underlying economic variables and the impact these have on equity, fixed income, hard currency and commodity markets. Managers employ a variety of techniques, both discretionary and systematic analysis, combinations of top down and bottom up theses, quantitative and fundamental approaches and long and short term holding periods. Although some strategies employ RV techniques, Macro strategies are distinct from RV strategies in that the primary investment thesis is predicated on predicted or future movements in the underlying instruments, rather than realization of a valuation discrepancy between securities. In a similar way, while both Macro and equity hedge managers may hold equity securities, the overriding investment thesis is predicated on the impact movements in underlying macroeconomic variables may have on security prices, as opposes to EH, in which the fundamental characteristics on the company are the most significant are integral to investment thesis. The constituent funds of the HFRI Macro (Total) Index – Asset Weighted are weighted according to the AUM reported by each fund for prior month.
- HFRI Relative Value (Total) Index – Asset Weighted Index includes Investment Managers who maintain positions in which the investment thesis is predicated on realization of a valuation discrepancy in the relationship between multiple securities. Managers employ a variety of fundamental and quantitative techniques to establish investment theses, and security types range broadly across equity, fixed income, derivative or other security types. Fixed income strategies are typically quantitatively driven to measure the existing relationship between instruments and, in some cases, identify attractive positions in which the risk adjusted spread between these instruments represents an attractive opportunity for the investment manager. RV position may be involved in corporate transactions also, but as opposed to ED exposures, the investment thesis is predicated on realization of a pricing discrepancy between related securities, as opposed to the outcome of the corporate transaction. The constituent funds of the HFRI Relative Value (Total) Index – Asset Weighted are weighted according to the AUM reported by each fund for prior month.
Material Risks Disclosures
Marketable Alternatives involves higher risk and is suitable only for sophisticated investors. Along with traditional market risks, marketable alternatives are also subject to higher fees, lower liquidity and the potential for leverage that may amplify volatility or the potential for loss of capital. Additionally, short selling involved certain risks including, but not limited to additional costs, and the potential for unlimited loss on certain short sale positions.
The information contained herein is confidential and the dissemination or distribution to any other person without the prior approval of Fiducient Advisors is strictly prohibited. Information has been obtained from sources believed to be reliable, though not independently verified. Any forecasts are hypothetical and represent future expectations and not actual return volatilities and correlations will differ from forecasts. This report does not represent a specific investment recommendation. The opinions and analysis expressed herein are based on Fiducient Advisor research and professional experience and are expressed as of the date of this report. Please consult with your advisor, attorney and accountant, as appropriate, regarding specific advice. Past performance does not indicate future performance and there is risk of loss.