Markets blaze ahead
Key Observations
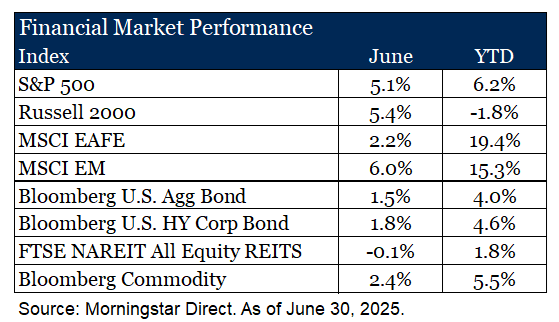
• Markets Advance in June – Despite geopolitical tensions and mixed policy signals, stocks powered higher with technology and industrials leading performance while small caps lagged.
• International Leads the Year – Robust local performance and a weakening U.S. dollar has buoyed returns in markets abroad.
• When Uncertainty is High, Context is Grounding – Recent price moves may cause concern for investors, but additional context may provide perspective on the weaker U.S. dollar and rising oil prices in June.
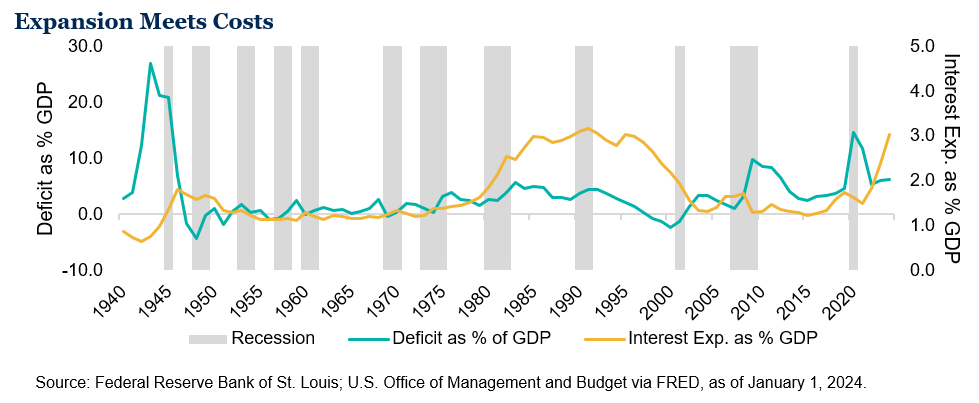
• Big Bill, Big Deficit – According to the Congressional Budget Office, the “Big Beautiful Bill” will increase the deficit by more than $2 trillion over the next ten years1. Expanding fiscal spending in a growing economy raises questions about long-term debt sustainability and funding sensitivity.
Market Recap
Markets gained ground in June, extending the year’s mostly positive performance despite geopolitical uncertainty and evolving policy signals. Volatility surfaced briefly following Middle East tensions, but sentiment stabilized quickly and showed evidence of investor resilience in the face of ongoing global uncertainty.
Investor muscle-memory kicked in and, once again, technology stocks and AI-centric constituents of the “Magnificent Seven” ticked higher. The sector climbed an impressive +9.8%, once again making it the month’s top performer. On the other hand, industrial stocks have quietly emerged as a top-performing sector this year, up +12.7%. That strength appears tied to investor optimism around pro-manufacturing policy goals from the current administration. Small caps struggled during the first half of the year with the biotech sector declining on anticipated scrutiny from U.S. policy and inflationary pressures.
The S&P 500 outpaced the MSCI EAFE by +2.9% and lagged the MSCI EM by -0.9% for the month. Year-to-date, international exposures remain ahead, supported by robust local market performance and a weaker U.S. dollar, which has enhanced returns.
Treasury yields declined across the curve in June. The 2-year yield ended the month at 3.7%, as markets priced in a higher likelihood of near-term Fed easing in response to softer growth data and a weaker-than-expected inflation print. Credit spreads also tightened, supported by steady demand and a favorable risk backdrop, despite mixed economic signals.
Commodity prices advanced in June, with gains across energy and metals, offsetting weakness in grains and soft commodities. Oil and natural gas rose early in the month due to heightened tensions in the Middle East and, despite some moderation later, ended higher overall.
REIT returns were down in June, with notable divergence across property types. Office and lodging/resort sectors led performance, benefiting from a modest rebound in demand and relative value interest. In contrast, data centers, self-storage and single-family rental REITs underperformed, reflecting concerns around elevated valuations and sensitivity to shifting growth expectations.
When Uncertainty is High, Context is Grounding
In a market environment that often reacts faster than it reflects, uncertainty is an almost constant companion. Today, that uncertainty is elevated, and understandably so. Fiscal dynamics are rapidly shifting; inflation is caught between opposing forces and policy is in flux. It is a time that calls for clarity, not certainty. And when clarity is hard to come by, context becomes our foundation.
Much has been made of recent U.S. dollar weakness and grumblings regarding the U.S. potentially losing its reserve currency status (a topic for another day). Similarly, with rising tensions in the Middle East, the price of oil has moved upward over the month, adding to inflation concerns. At first glance investors may have concern, but with a bit of context that concern may abate.
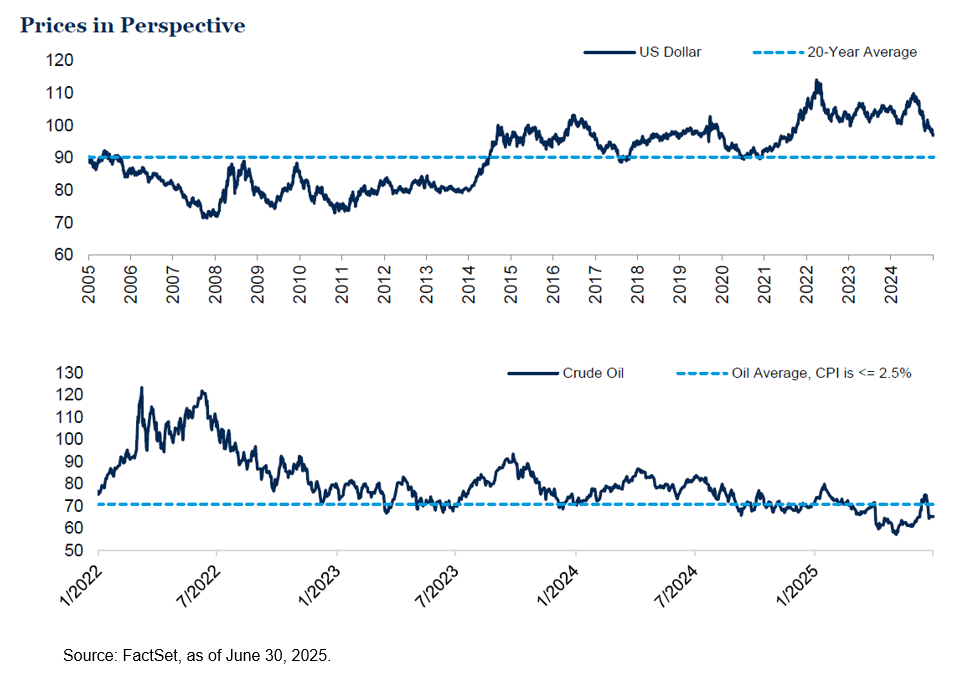
If we were to rephrase “U.S. dollar weakens -11% year-to-date” to “U.S. dollar retraces back to 2022 levels, remaining over 7% above the 20-year average” it may elicit different levels of concern. Or, if we mention that oil is below average historical levels where inflation was around 2.5%, that may also prompt varying degrees of concern. Context matters.
Big Bill, Big Deficit
Treasury markets have long absorbed large issuance volumes, though with the recent lack of clarity buyers are asking for more compensation (i.e., higher rates). The context on why brings us to the so-called “Big Beautiful Bill.” As proposed, the U.S. will be expanding its deficit in a non-recessionary environment. Typically, the government tends to spend more in recessionary periods to offset lower consumer spending and cushion the blow. The opposite should hold true in periods where markets are growing. With interest expense over 3% of GDP and no recession in sight, this combination is historically rare2. With debt levels elevated and rolling into higher rates, the long-term sustainability of U.S. borrowing is beginning to re-enter investor conversations.
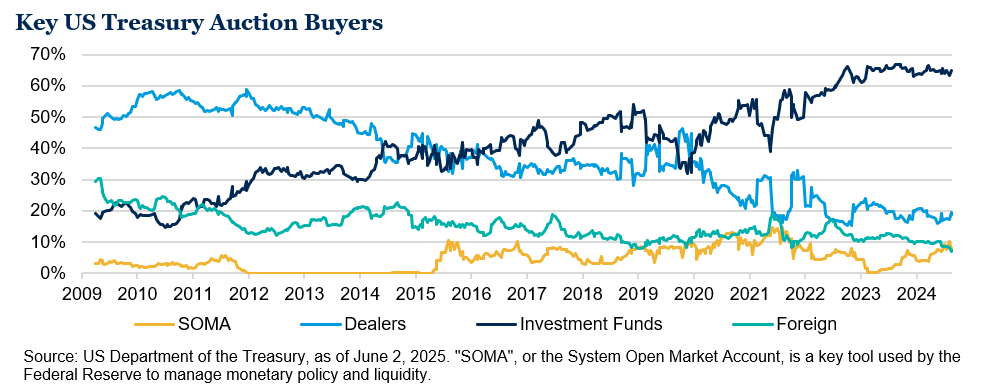
Additionally, investment funds now dominate at Treasury auctions, rather than previously obligated buyers like central banks or dealers. This has the potential to make Treasury markets more sensitive to sentiment and flows which can impact the cost of funding a large deficit. For investors without explicit clarity on the future direction of rates (which means all of us), the long end of the Treasury market may present as more volatile in this period of uncertainty.
Outlook
The dollar is weakening. The deficit is growing. The curve is steepening. Rates remain elevated. These signals are not pointing in one direction, but they are flashing that the market is uncertain and deeply sensitive to fiscal and monetary decisions.
Our process is not about predicting every market twist, but rather aligning positioning with the underlying incentives that shape policy, capital flows and investment behavior. When uncertainty is high, context is grounding. And context today tells us that even with policy rates likely to fall at some point, the path there may not be smooth, especially if the market starts asking harder questions.
1Source: Congressional Budget Office. H.R. 1, One Big Beautiful Bill Act (Dynamic Estimate).
2 Federal Reserve Bank of St. Louis; U.S. Office of Management and Budget via FRED, as of January 1, 2024.
Disclosures & Definitions
Comparisons to any indices referenced herein are for illustrative purposes only and are not meant to imply that actual returns or volatility will be similar to the indices. Indices cannot be invested in directly. Unmanaged index returns assume reinvestment of any and all distributions and do not reflect our fees or expenses. Market returns shown in text are as of the publish date and source from Morningstar or FactSet unless otherwise listed.
- The S&P 500 is a capitalization-weighted index designed to measure performance of the broad domestic economy through changes in the aggregate market value of 500 stocks representing all major industries.
- Russell 2000 consists of the 2,000 smallest U.S. companies in the Russell 3000 index.
- MSCI EAFE is an equity index which captures large and mid-cap representation across Developed Markets countries around the world, excluding the U.S. and Canada. The index covers approximately 85% of the free float-adjusted market capitalization in each country.
- MSCI Emerging Markets captures large and mid-cap representation across Emerging Markets countries. The index covers approximately 85% of the free-float adjusted market capitalization in each country.
- Bloomberg U.S. Aggregate Index covers the U.S. investment grade fixed rate bond market, with index components for government and corporate securities, mortgage pass-through securities, and asset-backed securities.
- Bloomberg U.S. Corporate High Yield Index covers the universe of fixed rate, non-investment grade debt. Eurobonds and debt issues from countries designated as emerging markets (sovereign rating of Baa1/BBB+/BBB+ and below using the middle of Moody’s, S&P, and Fitch) are excluded, but Canadian and global bonds (SEC registered) of issuers in non-EMG countries are included.
- FTSE NAREIT Equity REITs Index contains all Equity REITs not designed as Timber REITs or Infrastructure REITs.
- Bloomberg Commodity Index is calculated on an excess return basis and reflects commodity futures price movements. The index rebalances annually weighted 2/3 by trading volume and 1/3 by world production and weight-caps are applied at the commodity, sector and group level for diversification.
Material Risks
- Fixed Income securities are subject to interest rate risks, the risk of default and liquidity risk. U.S. investors exposed to non-U.S. fixed income may also be subject to currency risk and fluctuations.
- Cash may be subject to the loss of principal and over longer periods of time may lose purchasing power due to inflation.
- Domestic Equity can be volatile. The rise or fall in prices take place for a number of reasons including, but not limited to changes to underlying company conditions, sector or industry factors, or other macro events. These may happen quickly and unpredictably.
- International Equity can be volatile. The rise or fall in prices take place for a number of reasons including, but not limited to changes to underlying company conditions, sector or industry impacts, or other macro events. These may happen quickly and unpredictably. International equity allocations may also be impacted by currency and/or country specific risks which may result in lower liquidity in some markets.
- Real Assets can be volatile and may include asset segments that may have greater volatility than investment in traditional equity securities. Such volatility could be influenced by a myriad of factors including, but not limited to overall market volatility, changes in interest rates, political and regulatory developments, or other exogenous events like weather or natural disaster.
- Private Real Estate involves higher risk and is suitable only for sophisticated investors. Real estate assets can be volatile and may include unique risks to the asset class like leverage and/or industry, sector or geographical concentration. Declines in real estate value may take place for a number of reasons including, but are not limited to economic conditions, change in condition of the underlying property or defaults by the borrower.
- All investing involves risk including the potential loss of principal. Market volatility may significantly impact the value of your investments. Recent tariff announcements may add to this volatility, creating additional economic uncertainty and potentially affecting the value of certain investments. Tariffs can impact various sectors differently, leading to changes in market dynamics and investment performance. You should consider these factors when making investment decisions. We recommend consulting with a qualified financial adviser to understand how these risks may affect your portfolio and to develop a strategy that aligns with your financial goals and risk tolerance.
The information contained herein is confidential and the dissemination or distribution to any other person without the prior approval of Fiducient Advisors is strictly prohibited. Information has been obtained from sources believed to be reliable, though not independently verified. Any forecasts are hypothetical and represent future expectations and not actual return volatilities and correlations will differ from forecasts. This report does not represent a specific investment recommendation. The opinions and analysis expressed herein are based on Fiducient Advisor research and professional experience and are expressed as of the date of this report. Please consult with your advisor, attorney and accountant, as appropriate, regarding specific advice. Past performance does not indicate future performance and there is risk of loss.