A look into how the year in private markets unfolded and thoughts for a successful 2023
Key Observations
• The pace within private markets – from fundraising to deal activity – moderated over the back half of 2022 following a frenetic multi-year period.
• Many investors grappled with the denominator effect as declining portfolio values led by sharp declines in public markets were met with lagged valuations in private markets, creating a rise in those allocations. Programmatic deployment, vintage year diversification and consistent planning help to combat these periods and stay on track long-term.
• As we look forward, we see a market of “haves” and “have nots” where sought-after sponsors have an easier time raising capital than peers and certain limited partners are better positioned to take advantage of the opportunity set.
• Overall, we remain convicted in the asset class and in our philosophical approach that prioritizes operational prowess and capitalizing on market inefficiencies.
Introduction
For many, 2022 was a year of resetting expectations. Public markets – both equity and debt – were faced with pressure as a result of persistent inflation and corresponding interest rate hikes. Investors were left with few places to hide as the market adjusted to the ramifications of a new era. The capital markets disruption also had notable, if not material, impacts on the private markets. Fundraising fell, deal volume fell, exits slowed and the delay, as well as less drastic changes in valuations resulted in a meaningful denominator effect for many limited partners (“LPs”). There were also multiple acute events that sent shocks through the market such as the blowup of FTX or, more recently, the downfall of Silicon Valley Bank (“SVB”). These gripping episodes, while not necessarily abnormal in a historical context, highlight the importance of diligence, governance and diversification.
Fundraising Activity
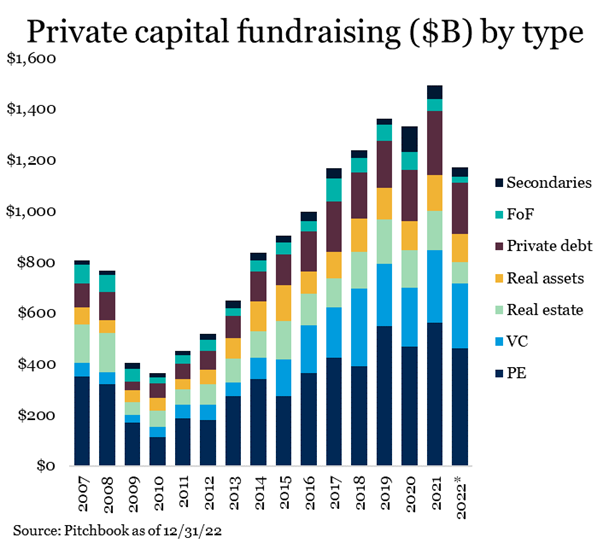
Fundraising cooled in the back half of 2022 but remained strong overall by historical standards. Fundraising across all private markets strategies fell 22% to $1.2 trillion.1 Private equity and venture capital fared better, while private real assets, credit and fundraising within fund of funds and secondaries took a greater hit. Within private equity specifically, fundraising continued to outpace any year prior to 2019. The slower pace by many pensions and some endowments was largely offset by family office participants. Consistent with previous years, the largest funds in the market continued to raise the majority of the capital. Funds over $1 billion raised 80% of the overall capital.2
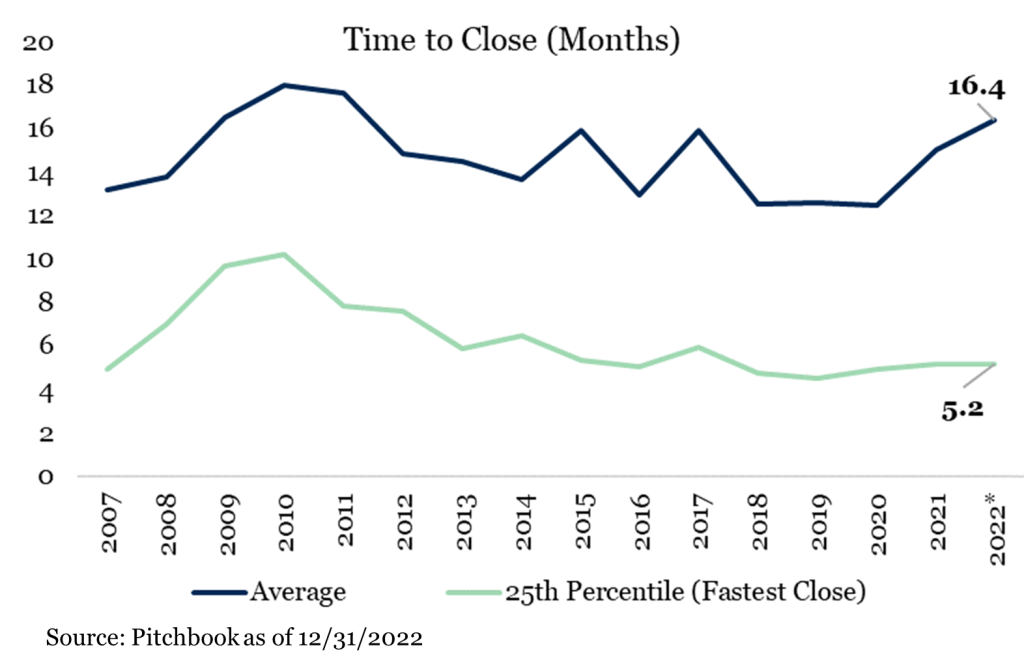
Unsurprisingly, the amount of time it has taken funds to close has increased rather dramatically. On average, for funds that had their final close in 2022, it took 16.4 months from start to finish. That is the longest average fundraising period since 2011. We see this metric continuing to rise in 2023 as the first half of 2022 was only partially impacted and funds that are still in the market are excluded from that calculation. As we discuss opportunities with peer investors, many are delaying commitment decisions where possible, and many GPs are recognizing that they need to distribute capital from prior funds back to LPs or have a seeded portfolio to attract and incentivize LPs to move forward.
It is worth highlighting, however, that the top 25 percent of funds that are fastest to close – i.e., seeing the highest demand – remained at nearly an all-time low of 5.2 months to close. This means the market for highly sought after funds is as competitive as it has ever been, and we believe this trend continues and even intensifies. As much as anything, this is an underlying signal that, regardless of the market environment, the importance of having a dedicated team to secure access to the top managers and continually navigate the market is invaluable.
Given these dynamics, the number of funds currently in market has ballooned to over 8,000 according to Preqin3. This is more than double the long-term averages. It’s likely that many of these firms miss their fundraising targets and feasible that there are many who miss by a wide margin. With the continued theme of “have” and “have nots,” it’s possible, maybe even probable, that “zombie funds” emerge where firms do not have enough management fee income to support the growth they anticipated or need to scale down resources because they hired ahead of anticipated growth. From a diligence standpoint, it is important to assess the ability of a firm to have enough revenue to sufficiently staff investment and operations teams with “A+” talent. It is also vital to understand the types of organizations (other limited partners) that will be investing alongside our clients. Both diligence points help develop confidence that a particular firm can raise an appropriate amount of capital for the opportunity set and operate successfully.
1 Pitchbook as of December 31, 2022
2 Pitchbook as of December 31, 2022
3 Preqin 2023 Global Private Equity and Venture Capital Annual Reports
Disclosures and Definitions
Comparisons to any indices referenced herein are for illustrative purposes only and are not meant to imply that actual returns or volatility will be similar to the indices. Indices cannot be invested in directly. Unmanaged index returns assume reinvestment of any and all distributions and do not reflect our fees or expenses.
- US Private Equity Index is a horizon calculation based on data compiled from 1,482 US private equity funds, including fully liquidated partnerships, formed between 1986 and 2022.
- US Buyout Index is a horizon calculation based on data compiled from 1,070 US buyout funds, including fully liquidated partnerships, formed between 1986 and 2022.
- US Growth Equity Index is a horizon calculation based on data compiled from 412 US growth equity funds, including fully liquidated partnerships, formed between 1986 and 2022.
- US Venture Capital Index is a horizon calculation based on data compiled from 2,322 US venture capital funds, including fully liquidated partnerships, formed between 1981 and 2022.
- Real Estate Index is a horizon calculation based on data compiled from 1,305 real estate funds, including fully liquidated partnerships, formed between 1986 and 2022.
- The S&P 500 Index is a capitalization-weighted index designed to measure performance of the broad domestic economy through changes in the aggregate market value of 500 stocks representing all major industries.
Material Risks Disclosures
- Real Assets can be volatile and may include asset segments that may have greater volatility than investment in traditional equity securities. Such volatility could be influenced by a myriad of factors including, but not limited to overall market volatility, changes in interest rates, political and regulatory developments, or other exogenous events like weather or natural disaster.
- Private Equity involves higher risk and is suitable only for sophisticated investors. Along with traditional equity market risks, private equity investments are also subject to higher fees, lower liquidity and the potential for leverage that may amplify volatility and/or the potential loss of capital.
- Private Credit involves higher risk and is suitable only for sophisticated investors. These assets are subject to interest rate risks, the risk of default and limited liquidity. U.S. investors exposed to non-U.S. private credit may also be subject to currency risk and fluctuations.
- Private Real Estate involves higher risk and is suitable only for sophisticated investors. Real estate assets can be volatile and may include unique risks to the asset class like leverage and/or industry, sector or geographical concentration. Declines in real estate value may take place for a number of reasons including, but are not limited to economic conditions, change in condition of the underlying property or defaults by the borrow.
The information contained herein is confidential and the dissemination or distribution to any other person without the prior approval of Fiducient Advisors is strictly prohibited. Information has been obtained from sources believed to be reliable, though not independently verified. Any forecasts are hypothetical and represent future expectations and not actual return volatilities and correlations will differ from forecasts. This report does not represent a specific investment recommendation. The opinions and analysis expressed herein are based on Fiducient Advisor research and professional experience and are expressed as of the date of this report. Please consult with your advisor, attorney and accountant, as appropriate, regarding specific advice. Past performance does not indicate future performance and there is risk of loss.