Adapting amid shifts and spotting silver linings
Key Observations
- Elevated interest rates tempered deal activity and fundraising momentum. Buyout funds, which are more reliant on debt financing, saw exit activity fall 54% by value and 30% by count relative to 2022. For the first time in over a decade, the number of growth equity deals exceeded that of buyout deals, mainly because the strategy isn’t as dependent on outside financing. Add-on acquisitions gained traction over platform acquisitions due to their smaller size, while GPs prioritized value enhancement initiatives for their current portfolio holdings.1
- Exit activities have dwindled, amplifying the impending maturity wall. While holding companies edged closer to their natural sale timeframe, GPs showed reluctance due to
lower valuations. - Private equity valuations underwent a broad correction, with the median enterprise value to EBITDA multiple declining by ~18.5%.2
- Our strategic approach to private markets – favoring lower leverage and organic operational improvements that bolster business fundamentals – resonates well with the present market landscape. We maintain an optimistic view on the long-term prospects of the asset class.
Introduction
Private market participants, from Limited Partners (LPs) to General Partners (GPs) and intermediaries, have been playing the waiting game. The initiation of interest rate hikes by Central Banks in early 2022 as a way to fight inflation has had a ripple effect across the private market landscape with both deal activity and fundraising exhibiting declines. Although narrowing, there continues to be a gap in asset valuations among buyers and sellers which has led to subdued activity. Further, the increasing cost of capital coupled with reduced appetite amongst lenders means it is more challenging to secure financing. As such, attention has shifted to smaller deals vis-à-vis add-on acquisitions as well as growth equity transactions that are not as reliant on leverage. The overarching view is that we are experiencing a healthy correction. While broad market distributions may be slower than expected, we have conviction in the return prospects for thoughtfully diversified programs that emphasize strong investment and operational due diligence.
Fundraising Activity
Private equity fundraising within the U.S. has been on a record-breaking run over the last two years. Unsurprisingly, the first half of 2023 moderated in comparison, with fundraising activity coming in 15-25% slower on a year-over-year basis; thus far, the number of funds recording their final close was barely 25% of what it was in 2022 (160 funds closed through the first half of 2023 compared to a total of 645 funds which closed in 2022).3 The bright spot within private equity fundraising was the middle market – defined by PitchBook as funds between $100 million and $5 billion in size – which is on track to have its best fundraising year ever.4
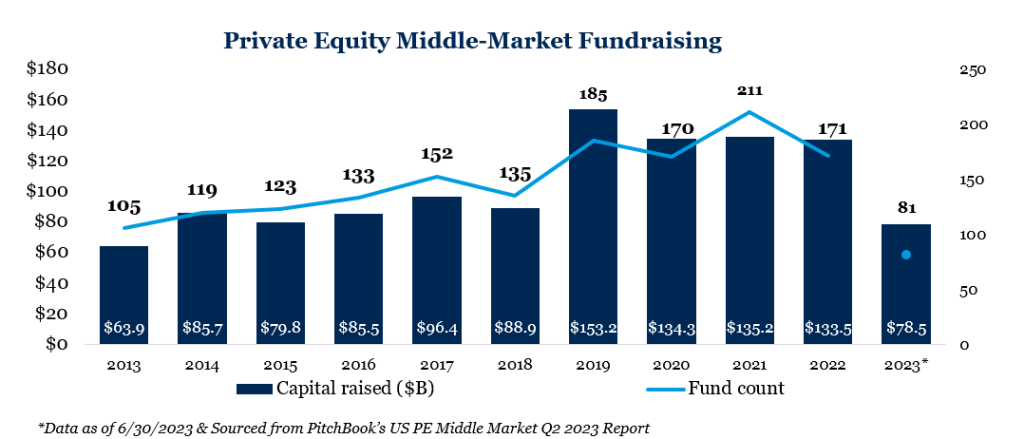
Middle market funds accounted for 57.4% of all private equity fund value closed in 2023, up from a 15-year low of 47.4% in 2022. On a numerical basis, the middle market’s share of all PE (private equity) fund closings is at a record high of 60.5%.3 We believe this is due to a combination of mega-fund fatigue among LPs, an uncertain macro environment and limited distributions to redeploy. Funds above $5 billion in size dominated the market over the past two years but the opportunity set remains limited in comparison to the lower and middle market, especially considering the higher cost of capital. Entry multiples continue to be more favorable in the lower and middle market as these businesses are less professionalized in nature and often founder owned. Fiducient Advisors views the lower middle market as fertile ground and our belief is Fiducient’s long-standing relationships will continue to offer capacity to highly sought after sponsors.
If we look beyond the U.S. market, global fundraising across private markets has been in decline since the fourth quarter of 2021, with an even steeper drop in the last year.5 Of course, not all strategies fared in a similar way. LPs have significantly pulled back from both venture capital and real assets while the secondaries market benefited from an influx in capital.
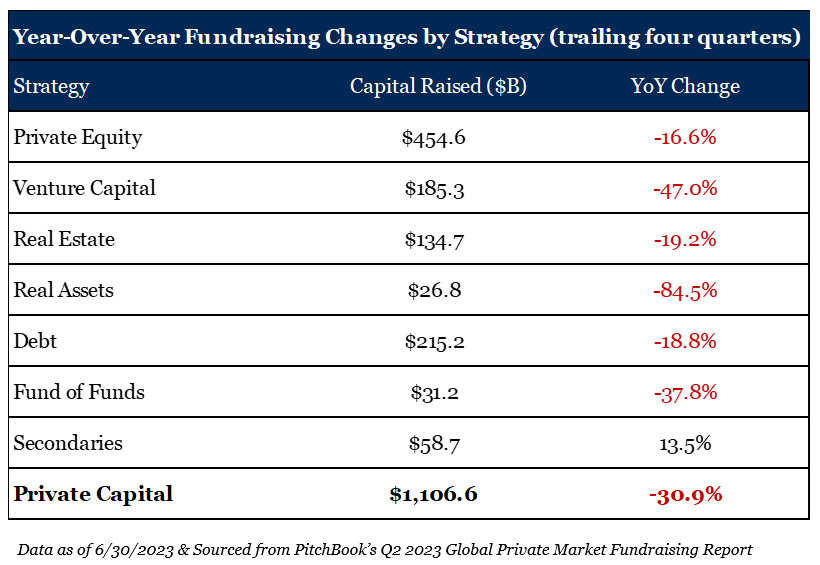
Within venture capital, one of the major culprits was the absence of large funds. According to PitchBook, $1 billion-plus funds accounted for more than 40% of commitment totals in 2018 and 2022; at 15% of total commitments through the first half of 2023, these funds accounted for the lowest percentage of the total since 2013.5 Why the drastic change?
There are two primary reasons. First, a significant amount of capital was raised, and as valuations declined, deal activity as well as the average check size followed. This has been notable within late-stage venture, where the largest funds are forced to focus their efforts. This dynamic simply means that capital raised will take longer to deploy. The second reason is that LPs are waiting for portfolio company realizations prior to committing additional capital and distributions have been thinnest within venture capital over the past 12 months.
Fiducient Advisors has prioritized early-stage venture capital managers for numerous reasons – valuations are often less impacted by public market swings, outcomes are less reliant on the IPO market timing, sponsors frequently have greater negotiating power, entry multiples are typically more attractive and the list goes on. Although fundraising is challenged, we believe that the top tier venture managers will continue to attract the best entrepreneurs and that innovative companies can be born in any market environment. As such, we will continue to invest with our highest conviction GPs and look to build new relationships with those that may need a new partner in these tumultuous times.
Dealmaking
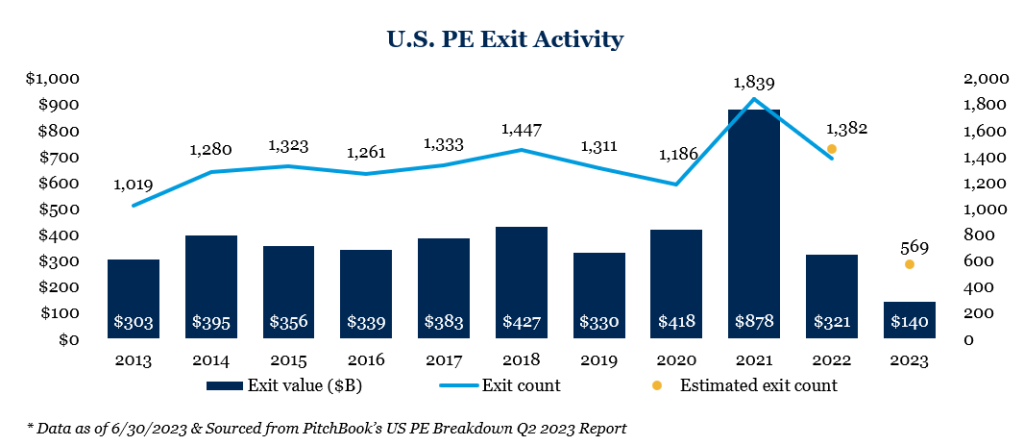
Both deployment of capital and portfolio company realizations remained depressed relative to peak levels in 2021. As of June 2023, U.S. private equity deal value stood at $418.3 billion; since the fourth quarter of 2021, quarterly volumes were down 49.2% by deal value and 24.0% by deal count.6 In the current environment, sponsors are spending more time reviewing portfolio company performance, assessing debt service requirements, resetting value creation plans and ultimately aiding management teams as they navigate economic uncertainty. GPs are hesitant to invest when there is a broad lack of clarity as to what the next three to five years look like from an interest-rate and macro standpoint. Understandably, GPs are also hesitant to exit when valuations are low, although the pressure to do so is mounting.
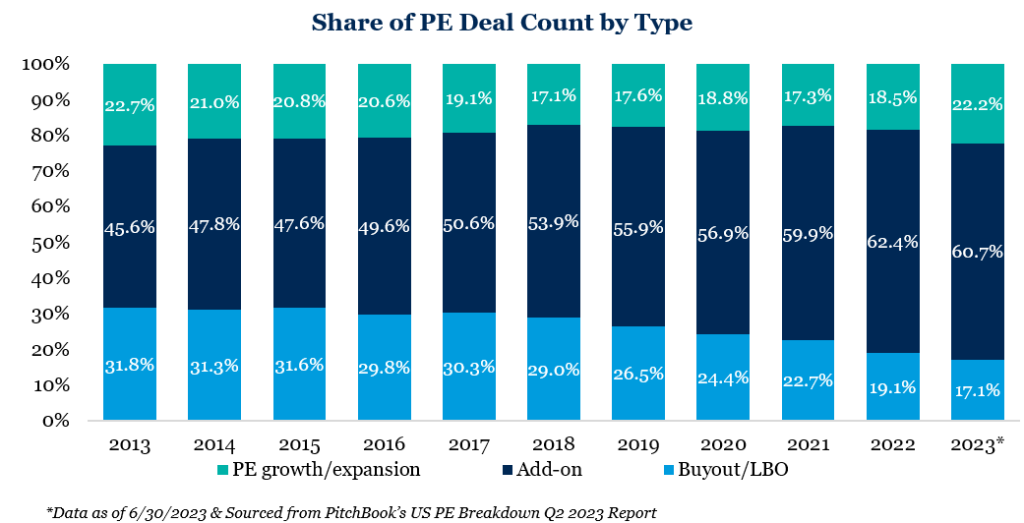
There were, however, pockets of activity in the form of add-on acquisitions, growth equity deals, corporate carve-outs and take-private transactions. Overall, deal sizes were smaller as participants waded through murky interest rate waters. Growth equity, unlike buyout, is less reliant on debt. As such, the strategy expanded its share of the market to 22.2% in the first half of 2023, which is an increase from 18.5% in 2022 and near its record high of 22.7% set in 2013. If this pace continues, it will be the first year in over a decade where growth equity transactions outnumber buyout transactions.6
Anecdotally, although scarce, high quality deal flow was aggressively priced and the time to diligence these assets was short given the competitive nature of the market. Further, less leverage was utilized as the cost of debt rose and sellers wanted greater assurance that a deal would be completed. We heard numerous cases of sponsors structuring buyout deals with all cash just to ensure that they were the chosen bidder, presumably with the goal of executing a dividend recapitalization in a more favorable lending environment.
A real cause of concern is the impending maturity wall given the lack of exit volume. The deterioration of various exit channels, most notably the closure of the IPO market, exacerbated this issue. Deals that were made five-plus years ago are reaching their natural time of exit, and sponsors are facing pressure from LPs to return capital, which of course is another reason fundraising has stalled.
According to Bain & Company, over the year’s first half, buyout-backed exits fell to $131 billion, a 65% decline from the same period a year ago. On an annualized basis, exit value is tracking down 54%, and exit count is off 30% compared with 2022.7 GPs will need to pick up the pace or LP frustration will continue to grow. In response to these market dynamics, there was greater activity across NAV lending, continuation funds and secondaries to address capital needs.
Although overall distributions have been slower, we continue to see exit opportunities within our core area of focus. While large transactions that require substantial lending or public exits are challenged, this has buoyed the need for large funds to employ more aggressive add-on activity in an attempt to blend down entry multiples and show growth. We are optimistic that we will continue to see an uptick in deal activity where exit opportunities are less reliant on ideal capital markets conditions.
Real Estate, Real Assets and Debt
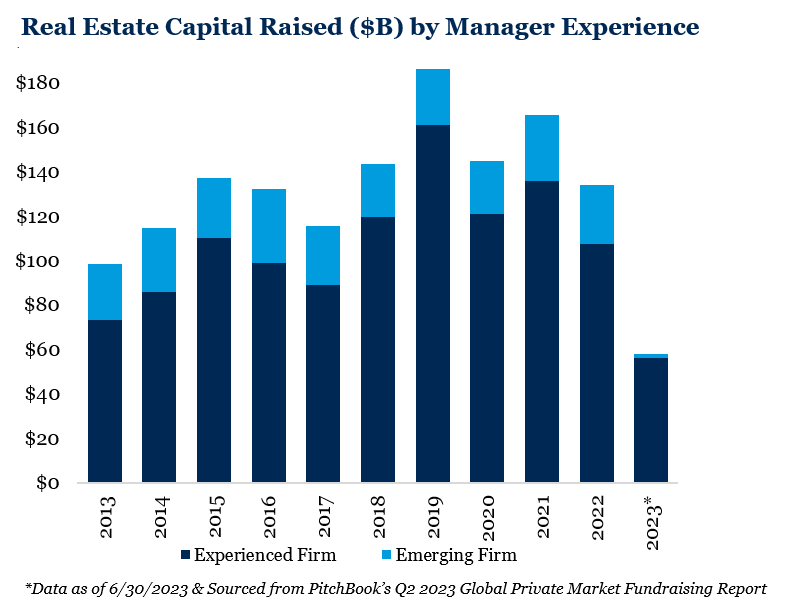
Narrowing in on real estate specifically, fundraising in the first half of the year was dominated by just one fund. Globally, there were a paltry 78 funds that closed, but Blackstone Real Estate Partners X was responsible for raising a whopping $30.4 billion of the total $58.3 billion raised in the market.8 This is the largest closed-end private real estate fund to ever be raised and it will invest broadly across rental housing, hospitality, lab office, logistics, data centers and more.9 While experienced real estate firms always have an edge over emerging managers, this preference was more evident in the last six months than ever before, raising 96.7% of capital.8 LPs clearly sought comfort in large and familiar firms.
As real estate investors committed to tried-and-true managers, real assets (oil and gas, timber and agriculture, metals and mining and infrastructure) investors did the opposite. There were 20 closed-end vehicles raised in the first six months of 2023, totaling $9.1 billion, and 97.1% of those commitments went to vehicles that were the first, second or third in their fund family.9 If this pace continues, real assets fundraising will have its worst year
in a decade.
Private debt continued to stand strong and garner interest from both institutional and retail investors. Not only is fundraising on track to exceed $200 billion for the fourth consecutive year, but private credit funds that continued to lend money in 2023 were one of the main reasons that private equity deal flow and the leveraged buyout market did not collapse as banks retreated.10 Mezzanine structures saw an uptick in demand from private equity sponsors, given that access to senior secured loans was challenged. In turn, capital raising followed in suit and mezzanine fundraising surpassed that of direct lending. The private equity industry is more reliant on private debt managers than ever before, which means GPs will need to be extra diligent in managing and assessing lending relationships.
Valuations and Performance
Private equity entry valuations declined in the first half of 2023. Valuations corrected across the board, but the discount varied depending on size of the deal. The most common valuation metrics in private equity are 1) median enterprise value (EV) to EBITDA multiple and 2) median EV to revenue multiple, with the latter being a broader measuring stick as it captures a larger sample size given some businesses are revenue-generating but not yet generating positive earnings. Median EV to EBITDA multiples fell 18.5% this year to 10.5x, after trading in a tight band between 11.5x and 12.4x from 2019 to 2022. Median EV to revenue softened to a lesser extent by approximately 10%, after peaking at 2.2x in 2022.11
Most interesting though is the gap in EV to revenue multiples bifurcated by size. On deals above $2.5 billion, the median EV to revenue multiple declined from 4.8x in 2022 to 4.0x while the median EV to revenue multiple on deals below $25 million declined from 1.0x to 0.8x.11 This is an extraordinary valuation range depending on deal size, highlighting the relative inefficiency of the lower middle market.
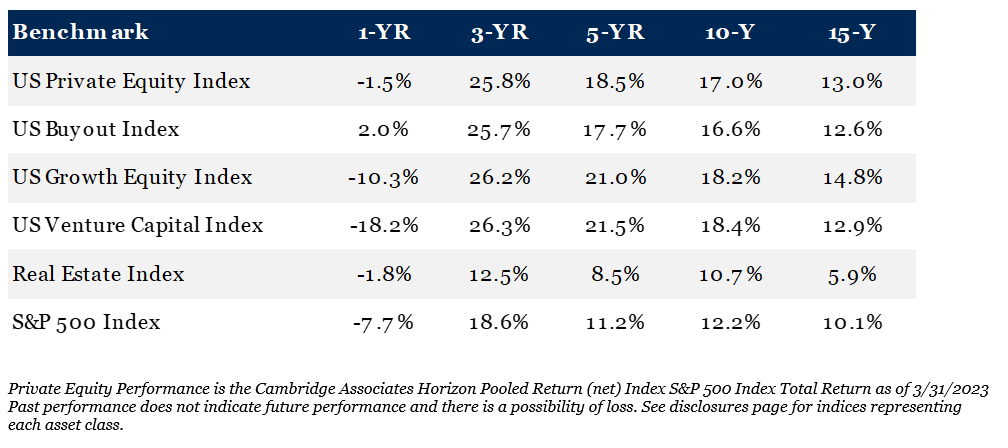
Turning to performance, both buyout and growth equity funds posted positive, albeit small, returns in the first quarter of the year. On an annualized basis, however, those numbers look vastly different as buyout funds remain in positive territory at 2.0% while growth equity stands at -10.3%.12 Venture capital took another hit in the first quarter, with one-year returns of -18.2%.12 Looking beyond one-year annualized returns, long-term private equity and venture capital performance remain quite strong. Private market valuations and performance tend to lag behind public markets and adjust over time.
In Closing
The first six months of 2023 was a period of caution and reassessment. Many GPs struggled to raise capital, most notably across real assets and venture capital. They focused on smaller transactions in the form of add-on acquisitions and growth equity deals. Meanwhile, others leaned into value-add initiatives across portfolio companies with the hope of improving business fundamentals and valuations in anticipation of a future exit.
LPs were also on guard, waiting to see how public market performance would impact broad portfolio construction and if distributions would improve. Actions speak louder than words and investors clearly communicated their liquidity concerns to GPs by delaying commitments.
Private market investing is as much of an art as it is science and managing liquidity or the expected cash flows via sophisticated pacing models is one of many tools in our toolkit. Fiducient Advisors maintains conviction in our private markets program despite macroeconomic headwinds. Our philosophical approach – partnering with thoughtful and operationally-intensive GPs that properly size funds to the investment opportunity set – encourages consistent commitments across vintage years and strategies. Further, while peers are pulling back, we are leaning in and gaining access to top tier managers that are open to new LP relationships. Overall, we remain enthusiastic as this market environment should provide us with opportunities to further enhance our clients’ investment portfolios.
For more information on private markets and our research process, get in touch with any of the experts at Fiducient Advisors.
1 Bain & Company Private Equity Midyear Report 2023; as of June 30, 2023.
2 PitchBook’s US PE Breakdown Q2 2023; as of June 30,2023
3 PitchBook’s US PE Breakdown Q2 2023; as of June 30,2023.
4 PitchBook’s US PE Middle Market Q2 2023 Report; as of June 30,2023.
5 PitchBook’s Q2 2023 Global Private Market Fundraising Report; as of June 30, 2023.
6 PitchBook’s US PE Breakdown Q2 2023; as of June 30,2023.
7 Bain & Company Private Equity Midyear Report 2023; as of June 30, 2023.
8 PitchBook’s Q2 2023 Global Private Market Fundraising Report; as of June 30, 2023
9 Business Wire Article on April 11, 2023 “Blackstone Announces $30.4 Billion Final Close for Largest Real Estate Drawdown Fund Ever”
10 PitchBook’s Q2 2023 Global Private Market Fundraising Report; as of June 30, 2023
11 PitchBook’s US PE Breakdown Q2 2023; as of June 30,2023.
12 Cambridge Associates Horizon Pooled Return (net) Index S&P 500 Index Total Return; as of March 31, 2023
The information contained herein is confidential and the dissemination or distribution to any other person without the prior approval of Fiducient Advisors is strictly prohibited. Information has been obtained from sources believed to be reliable, though not independently verified. Any forecasts are hypothetical and represent future expectations and not actual return volatilities and correlations will differ from forecasts. This report does not represent a specific investment recommendation. The opinions and analysis expressed herein are based on Fiducient Advisor research and professional experience and are expressed as of the date of this report. Please consult with your advisor, attorney and accountant, as appropriate, regarding specific advice. Past performance does not indicate future performance and there is risk of loss.