As China’s position size in the emerging markets index has grown so has interest in carving it out from a broader emerging markets (EM) allocation. In this paper, we examine the benefits and drawbacks of splitting EM into a dedicated China-only allocation and a separate EM-Ex China allocation. Ultimately, we conclude that investors should not carve China into a separate allocation at this time.
• Removing China from a broad EM index to solve country concentration issues leaves investors with two concentrated holdings, not one. Taiwan, India and Korea make up 59 percent of the MSCI EM Ex-China Index1.
• Individual country allocations are volatile and difficult to get right. The average spread between the best and worst returning EM countries is 98 percent. China’s worst to best calendar year return ranges from -51 percent to +88 percent. Among the 28 emerging countries reviewed during this time, China’s pole position ranked as high as first, as low as second to last and changed an average of eight places from year to year2.
• There are 14 EM Ex China portfolios traded today. This compares with the approximately 700 broad EM strategies otherwise available. For the real-world investor, it leaves this conversation largely in the theoretical, rather than the practical3.
Breaking Down the Case for Carving Out China
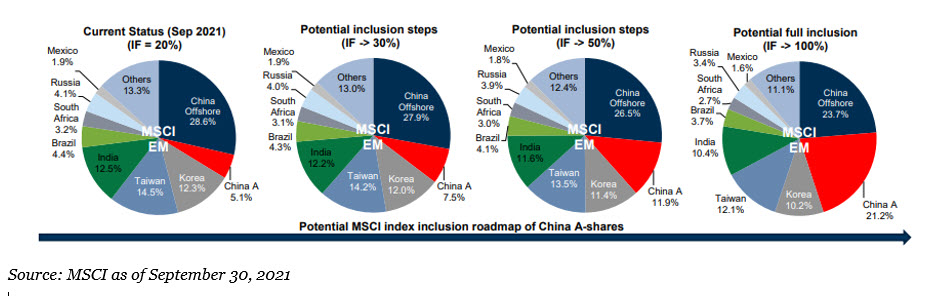
China is Too Large of an Allocation in the Index – China is 34 percent1 of the MSCI EM Index today, down from a peak of 43 percent in 20204. As MSCI continues to incorporate mainland-based companies (China A shares) into the index, this will likely increase China’s weight in the index back above 40 percent with the potential to become more than half the index in the future. If coupled with China’s long-term “one country” mentality toward Taiwan, it is easy to see the concentration risk.
MSCI Inclusion Factor Projections of China A Shares
Holding prices constant, MSCI projects a greater than 40 percent allocation to China
Response: This argument has merit and is perhaps the most reasonable basis for making a change. Over the past decade, annual performance of the largest 200 EM active mutual funds is approximately 90 percent correlated to the yearly returns of the MSCI China Index4. However, carving out China to address concentration risk might not be as helpful as one might think. In the MSCI EM Ex-China Index, concentration in the top three countries is effectively the same. China, Taiwan and India make up 60 percent of the MSCI EM Index1. In the MSCI EM Ex-China Index Taiwan, India and Korea make up a similar weighting of 59 percent1.
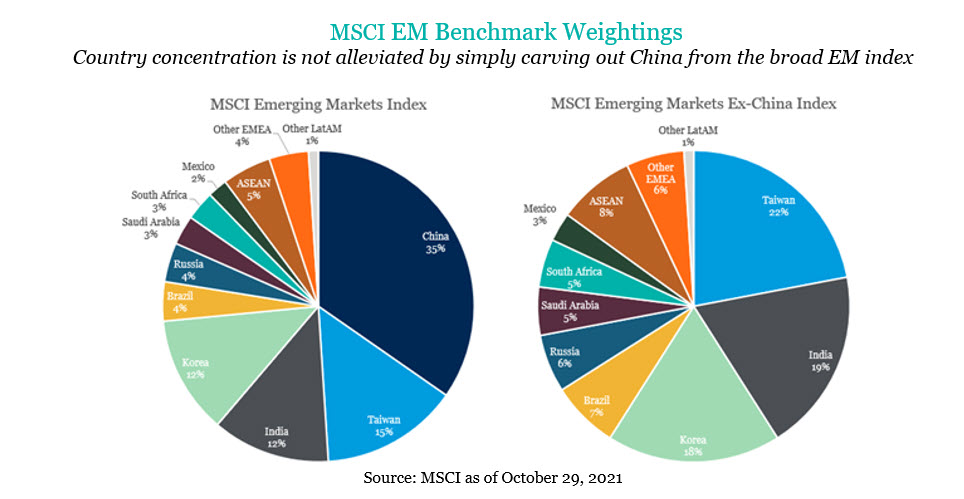
Additionally, single security concentration worsens slightly. A more material weighting to Taiwan Semiconductor and the top 10 constituents of each index continue to make up approximately 25 percent of the index.
1MSCI as of October 29, 2021
2Fiducient Advisors, Country Selection – A Fool’s Errand, August 2019
3Morningstar, eVestment, October 30, 2021
4Goldman Sachs EM ex-China as a separate equity asset class
The information contained herein is confidential and the dissemination or distribution to any other person without the prior approval of Fiducient Advisors is strictly prohibited. Information has been obtained from sources believed to be reliable, though not independently verified. Any forecasts are hypothetical and represent future expectations and not actual return volatilities and correlations will differ from forecasts. This report does not represent a specific investment recommendation. The opinions and analysis expressed herein are based on Fiducient Advisor research and professional experience and are expressed as of the date of this report. Please consult with your advisor, attorney and accountant, as appropriate, regarding specific advice. Past performance does not indicate future performance and there is risk of loss.