Key Observations
• Equity markets rebounded in October to new all-time highs.
• Treasury yields trended higher, leading to modest declines across most fixed income asset classes.
• U.S. and global central banks took initial steps toward tightening monetary policy (for historical perspective, markets produced positive returns when the Federal Reserve last shrank its balance sheet from 2015 through 2019).
Market Recap
Late third quarter market volatility quickly abated in October. After U.S. large cap stocks declined in September (the first monthly decline in seven months and the first drawdown of more than 5 percent for the year), the S&P 500 advanced 7 percent in October, supported by resilient corporate fundamentals. Overcoming supply chain bottlenecks and inflationary pressures, 84 percent of S&P 500 companies beat earnings expectations1 thus far in the reporting period – a near record high – with profits advancing 32 percent year-over-year2. The rotation into value stocks that occurred in late September was short-lived, with the Russell 1000 Growth Index (8.7 percent) outgaining the Russell 1000 Value Index (5.1 percent). Small-cap stocks (Russell 2000 Index) returned 4.3 percent but have trailed the return of large cap stocks in seven of the last eight months. International markets (MSCI ACWI ex-U.S. Index) returned 2.4 percent, as investors weighed diminishing concerns surrounding the potential default of Chinese property developer Evergrande along with the impact of energy shortages in China and the United Kingdom.
Returns were modestly lower across most fixed income asset classes for the month. Persistent inflationary pressures stemming from supply chain constraints and expectations for less accommodative monetary policy forced the U.S. 10-year Treasury yield to continue the ascent that began from its intra-year low of 1.19 percent on August 4, finishing the month at 1.55 percent3. Meanwhile, the yield of two-year Treasuries doubled since mid-September to 0.484percent, reflecting a rising probability of an initial rate hike in 2022. U.S. investment-grade bonds (Bloomberg U.S. Aggregate Bond TR) were nearly unchanged as the spreads of the highest-rated segments of corporate credit fell to levels below their pre-crisis lows5, offsetting the impact of higher Treasury yields. Five-year inflation expectations rose to their highest level since 20066, leading Treasury Inflation-Protected Securities (Bloomberg U.S. Treasury U.S. TIPS TR) to advance 1.1 percent.
A Policy Transition
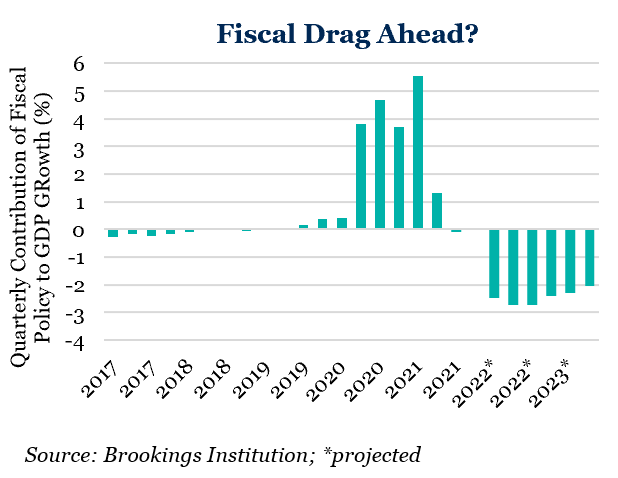
A pivot away from emergency levels of fiscal and monetary stimulus began in recent months. In September, Federal Reserve Chairman Jerome Powell indicated the Federal Reserve is likely to begin tapering its asset purchase program in November and now nine of 18 FOMC members expect a 2022 rate hike. Meanwhile, the effects of the emergency fiscal stimulus, resulting in the largest expansion of America’s federal budget deficit since World War II, will start to fade. According to the Hutchins Center on Fiscal and Monetary Policy at the Brookings Institution, overall government spending added significantly to economic growth in 2020 through the first quarter of this year; however, the forecast is for fiscal spending to potentially turn into a significant drag on growth by the fourth quarter of 2021 and through 20237.
Policy makers outside the U.S. were more aggressive in their response to rising inflation. Central banks in South Korea, Australia, Brazil, Russia, Mexico and Norway8 recently moved official rates up from historical lows. Meanwhile, the Bank of England indicated it could raise rates by year-end, and the European Central Bank will likely announce the retirement of its Pandemic Emergency Purchase Program next March.
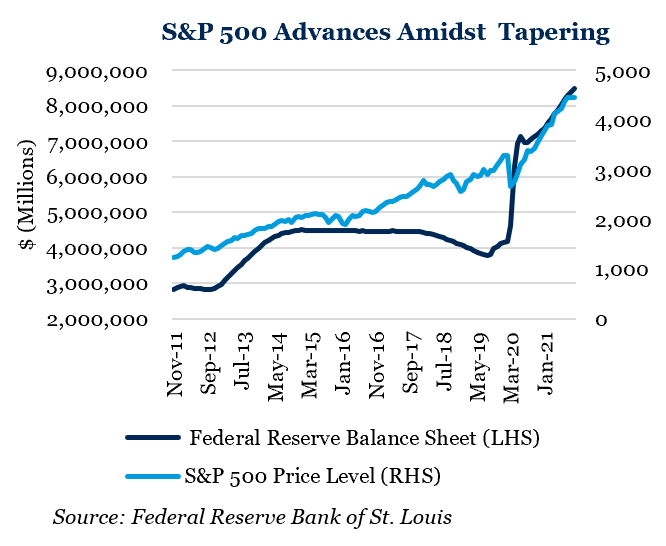
Equity markets displayed resilience throughout the last cycle of monetary policy tightening. The Federal Reserve reduced its balance sheet from a peak of $4.5 trillion in October 2014 to $3.8 trillion in August 20199, while raising the Federal Funds Target Rate from a range of 0.00-0.25 percent in late 2015 to a range of 2.25-2.50 percent through early 201910. Investors who remained invested through an initial spike in volatility in the early stages of policy normalization were rewarded with an average calendar year return for the S&P 500 of 12.5 percent from 2015 through 201911.
Market Outlook
Markets continue to weigh solid economic activity and corporate earnings against the potential impacts of inflationary pressures and a transition to less accommodative monetary and fiscal policy. Domestic equities ascended with historically low volatility to all-time highs after S&P 500 earnings expanded 94.2 percent year-over-year in the second quarter12. Yet, sentiment based on a somewhat evolving macro-economic outlook caused abrupt swings in leadership within broader indices. With the recovery of S&P 500 earnings to above pre-crisis levels and valuations at elevated absolute levels, we expect equity markets will likely trend more in-line with earnings growth in coming years. Persistent shifts in style leadership are possible as investors grapple with the transition to more normal levels of economic activity and monetary policy. To this end, we recommend investors maintain a portfolio anchored by reasonable long-term return expectations with diversification across assets that may benefit from a variety of macro-economic conditions.
For more information, please reach out to any of the professionals at Fiducient Advisors.
1“Expecting the Exceptional,” Northern Trust, October 22, 2021
2“Strong Earnings Propel Market Higher,” MFS, October 22, 2021
3Federal Reserve Bank of St. Louis, https://fred.stlouisfed.org/series/DGS10
4Federal Reserve Bank of St. Louis, https://fred.stlouisfed.org/series/DGS2
5Federal Reserve Bank of St. Louis, https://fred.stlouisfed.org/series/AAA10Y
6Federal Reserve Bank of St. Louis, https://fred.stlouisfed.org/series/T5YIE
7“Contribution of Fiscal Policy to Real GDP Growth,” Brookings Institution – Hutchins Center of Fiscal Impact, https://www.brookings.edu/interactives/hutchins-center-fiscal-impact-measure/
8“Central Policy Rates,” BIS, https://www.bis.org/statistics/cbpol.htm
9Federal Reserve Bank of St. Louis, https://fred.stlouisfed.org/series/WALCL
10Federal Reserve Bank of St. Louis, https://fred.stlouisfed.org/series/DFEDTARU
11Factset
12“U.S. Equity Market Attributes,” S&P, September 2021, https://www.spglobal.com/spdji/en/commentary/article/us-equities-market-attributes/
The information contained herein is confidential and the dissemination or distribution to any other person without the prior approval of Fiducient Advisors is strictly prohibited. Information has been obtained from sources believed to be reliable, though not independently verified. Any forecasts are hypothetical and represent future expectations and not actual return volatilities and correlations will differ from forecasts. This report does not represent a specific investment recommendation. The opinions and analysis expressed herein are based on Fiducient Advisor research and professional experience and are expressed as of the date of this report. Please consult with your advisor, attorney and accountant, as appropriate, regarding specific advice. Past performance does not indicate future performance and there is risk of loss.