Key Observations
• A lackluster showing from hedge funds in 2023 was driven largely by an underweight to mega-cap U.S. stocks. However, despite mega-cap outperformance in 2024, hedge funds are off to a compelling start.
• Higher interest rates may help hedge funds with significant short positions in their portfolios. Short rebate, a measure of how a hedge fund earns on collateral it posts to short stocks vs. what they owe to the short lender through dividends, has turned positive for the first time since 2008. While higher interest rates may drive additional opportunities and a tailwind for cash-efficient hedge fund strategies, they also come with heightened return expectations.
• We believe European High Yield offers a compelling opportunity based on structural inefficiencies and higher current yields in today’s market.
Out the Gate Running
After a strong performance in 2022, hedge funds entered 2023 very defensive on concerns around ongoing inflation and the possibility of a recession. In aggregate, hedge funds were considerably underweight1 the Magnificent 72 which returned an impressive 76% in 2023 while the rest of the S&P 500 returned just 8%3. As a result, many hedge funds faced challenges in a market primarily driven by mega-cap stocks and AI-driven narratives. Strategies with embedded equity exposure, such as the HFRI Equity Hedge (+11.4%) and HFRI Event Driven (+10.4%), faired relatively well in 2023. HFRI Macro struggled to perform, finishing the year in negative territory at -0.3%4.
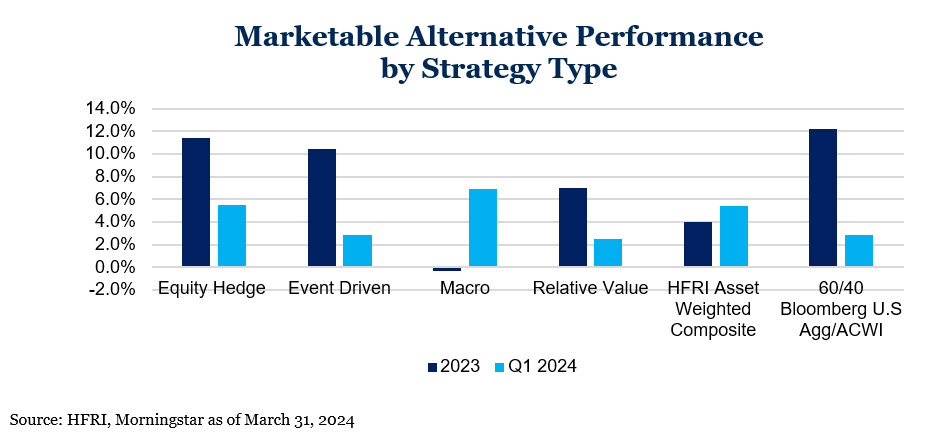
In spite of the Magnificent 7 continuing to outperform in the first quarter of 20245, hedge funds have come out of the gate strong. Most notable is the strong start of macro strategies with the HFRI Macro, generating +6.9% in the first quarter. Meanwhile, HFRI Equity Hedge (+5.5%), HFRI Event Driven (+2.8%), and HFRI Relative Value (+2.5%) have also had respectable starts to the year helping the HFRI Asset Weighted Composite (+5.4%) surpass 2023 cumulative performance in the first quarter of 2024. Although the year is still young, the solid collective start to the year for marketable alternatives is promising6.
What Higher Interest Rates Mean for Marketable Alternatives
The level of interest rates can have material impact on asset classes, hedge funds included. First, as interest rates rise so does the cost of running a business. For businesses with weak balance sheets, poor management teams, and/or an inferior business, the ability to hide those facts behind inexpensive debt is fading which may lead to greater dispersion between companies. While long-only investors can take advantage of those opportunities, hedge funds are well suited to also benefit as their short positions provide additional ways to generate return and manage risk.
Additionally, the prospect of rising interest rates could enhance the performance of hedge funds, especially cash-efficient strategies like Equity Market Neutral, Fixed Income Relative Value and strategies utilizing derivative instruments with low margin requirements.
To initiate a short position, a hedge fund must first borrow the security from the asset holder. In return, hedge funds pay a fee and post cash as collateral to safeguard against potential default. During the life of the short investment, the hedge fund responsible for borrowing the security is obligated to compensate the original owner for any dividends or interest generated for the asset. Meanwhile, the asset owner must distribute earned interest on the cash collateral back to the hedge fund. The interest earned on the cash collateral minus the fee to borrow the asset is referred to as the short rebate or stock loan rebate and can significantly impact the returns of a hedge fund, especially for those with substantial allocations to short positions.
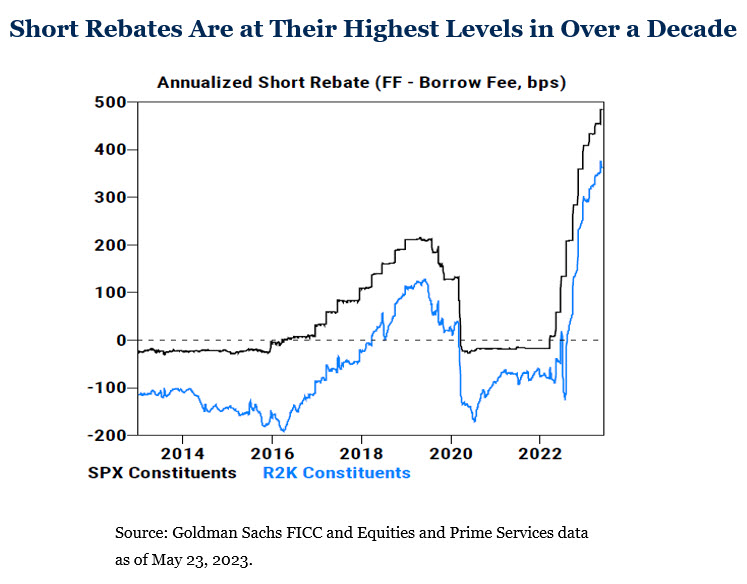
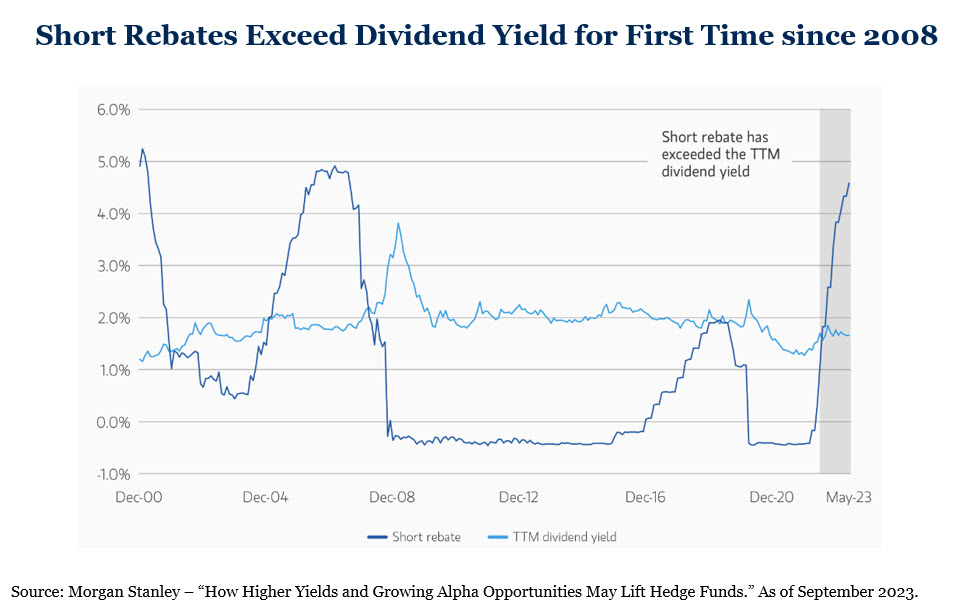
Recently, the short rebates of the S&P 500 and Russell 2000 have crossed into positive territory and are at their highest levels in over a decade. Meanwhile, the short rebate spread above the dividend yield, which is another measure for determining the “all-in” cost to short a stock, is positive for the first time since the Global Financial Crisis.
While these developments paint an optimistic picture of a hedge funds’ ability to add value to diversified portfolios, it is essential to consider that higher rates also come with higher absolute return expectations. Investors expect hedge funds to outperform the cash return “bogey” and deliver returns that justify the additional costs associated with investing in these strategies. As a result, hedge funds also face heightened pressure to meet these higher return expectations in the current rate environment.
Opportunity Set Spotlight: European High Yield
The Market
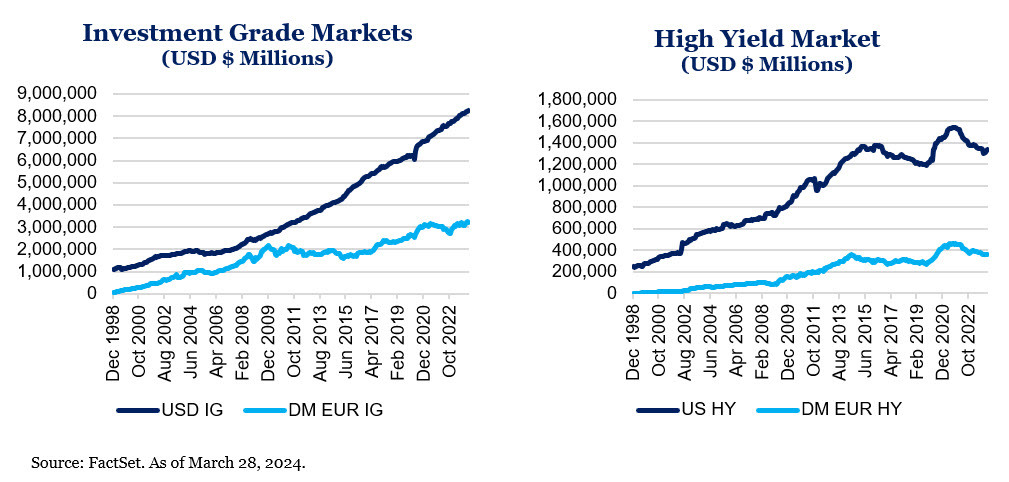
The European credit markets, distinct in their characteristics and scale when compared to the vast and well-trodden paths of the U.S. credit markets, offer a complex, but potentially rewarding, landscape for those willing and able to navigate its intricacies. The U.S. credit markets, renowned for their robustness and efficiency, are underpinned by a broad investor base and abundant capital resources. In contrast, Europe’s credit landscape is complex stemming from the continent’s varied legal frameworks, political climates and various languages which naturally lends to inefficiencies. These differences can be further highlighted by the vast difference in size across the High Yield (HY) and Investment Grade credit markets in Europe and the U.S.
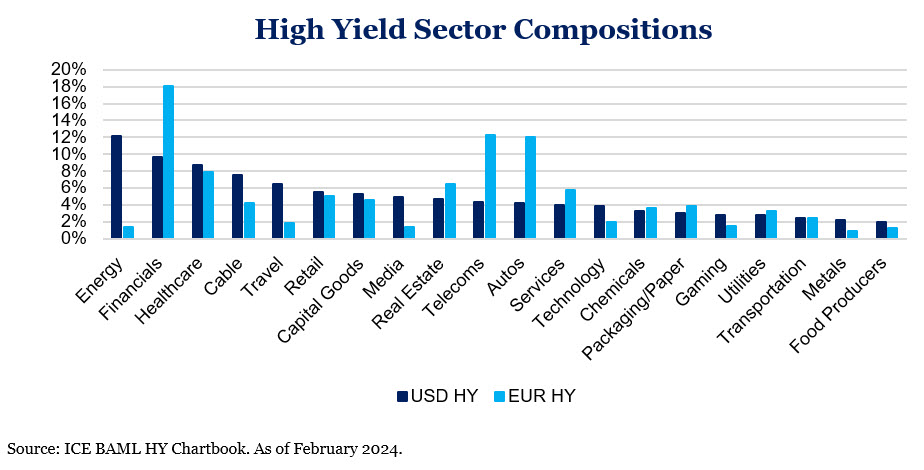
Another notable point of comparison lies in the sector composition of the European HY market, which is highly different from the U.S. market. The European HY market shows considerable underweight in the Energy sector, reflecting different economic structure and energy policies, while displaying an overweight in Financials, Autos and Telecoms relative to the U.S.
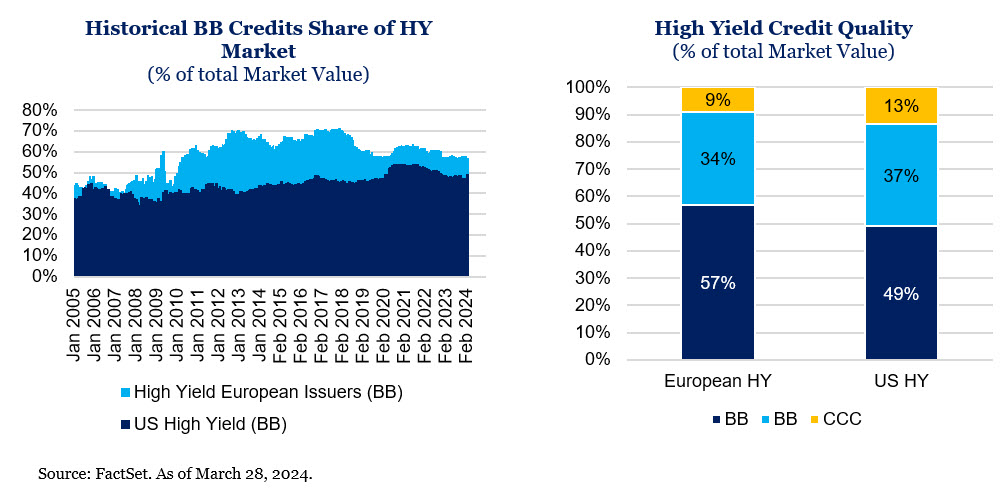
Furthermore, the distribution of credit quality within the High-Yield markets in Europe and the U.S. reveals significant differences. The U.S. High-Yield market tends towards a lower quality bias, with a larger proportion of CCC-rated bonds compared to Europe, where BB-rated bonds comprise a majority of the High Yield market.
The Backdrop
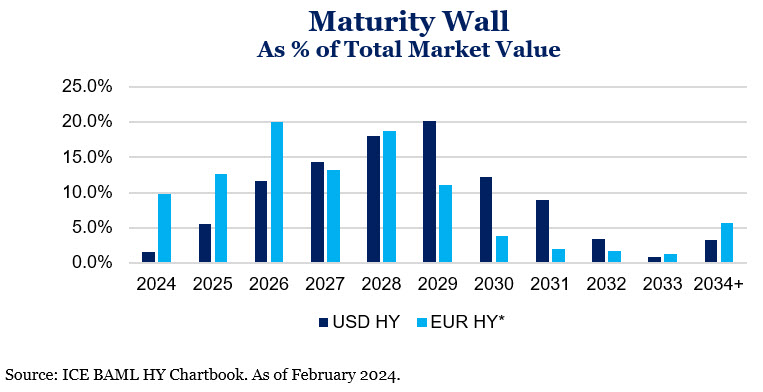
Unlike the U.S. High-Yield market, which has its highest year of maturities as far out as 2029, the Euro High-Yield market will see far more refinancing, restructuring and potential defaults over the next few years as a significant portion of the EUR High-Yield Market, approximately 43%, is due to mature by the end of 2026.
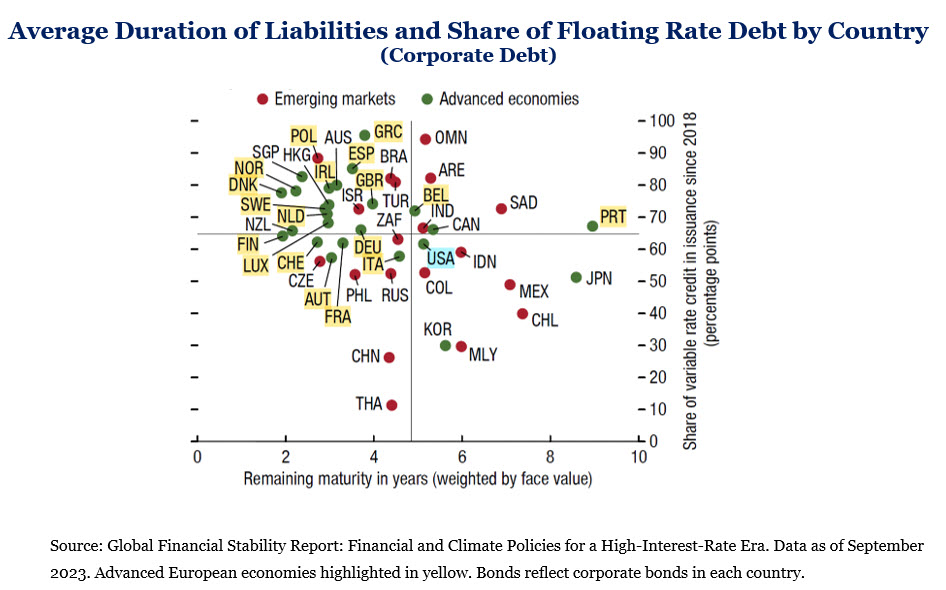
Taking it a step further, as indicated in the upper left quadrant of the chart below, we can see that a vast majority of corporate bonds maturing in the next few years from around the globe is not only heavily skewed within developed Europe, but also that a vast majority of this corporate outstanding debt is floating rate. Unlike much of the U.S-based corporate debt, which is a fixed rate, combining higher interest rates with the floating rate nature of corporate debt throughout Europe puts immediate pressure on balance sheets and business models. This backdrop sets the stage for hedge fund managers with expertise in credit analysis and debt restructuring to capitalize on potential opportunities.
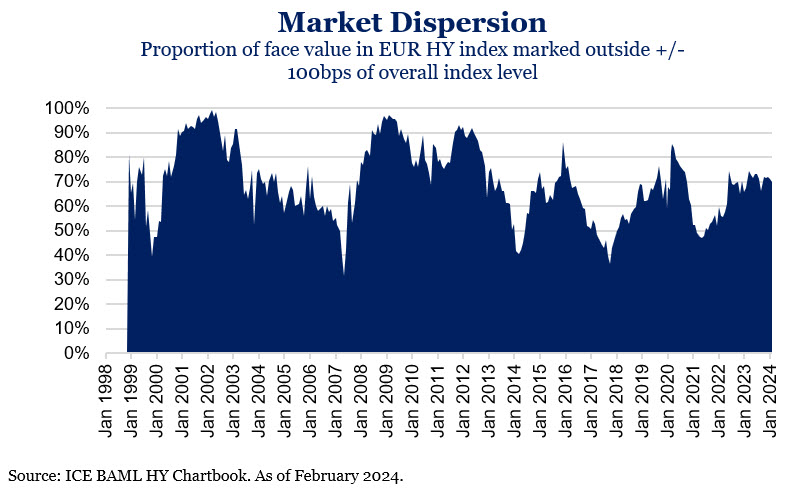
Another way to identify how these inefficiencies lead to opportunity is market dispersion, a measure of price discrepancy. Using this metric, we see 70% of the EUR HY Market currently trades outside the common 100 basis points range of the EUR HY Index. With more disagreement among investors on what an asset is worth is more opportunity for skilled active credit managers who can identify underpriced (buy candidates) and overprice (short sell candidates) securities.
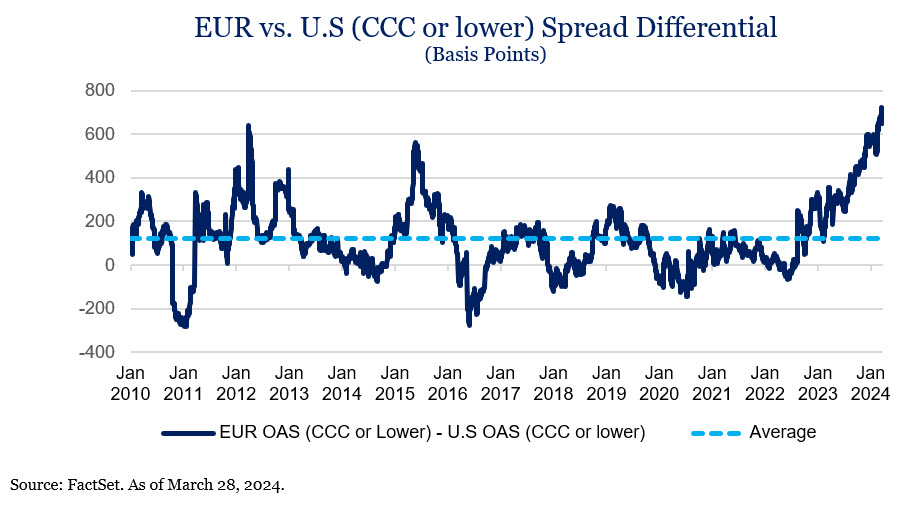
Finally, European HY Bonds historically have higher yields on average, even when compared to their similarly rated counterparts in the U.S. This trend draws particular interest today, especially down the credit quality spectrum, as the yield differential between EUR HY CCC and U.S. HY CCC bonds has reached its highest point since post the Global Financial Crisis. The EUR HY CCC Option Adjusted Spread (OAS), a measure of potential return above a risk-free rate, is approximately 700 basis points wider than the U.S. HY CCC spread, a level not reached since the Global Financial Crisis.
In Closing
With its unique blend of challenges and opportunities, the European credit market stands out as a compelling opportunity for skilled hedge fund managers and opportunistic allocators. The imminent maturity of a substantial portion of the High-Yield market, high amounts of floating-rate debt, up-trending dispersion and notable yield differentials relative to the U.S. underscores an opportunity set that warrants close attention. These factors, combined with prevailing inefficiencies within the region, paint a picture of a market ripe with opportunities for those equipped to navigate its complexities. As investors look toward the future, the European High Yield credit market, with its distinctive characteristics and potential for value creation, remains a compelling option for those seeking to diversify and enhance their investment portfolios.
For more information on marketable alternatives, please contact any of the professionals at Fiducient Advisors.
1GS Global Investment Research November 20, 2023
2Apple (AAPL), Alphabet (GOOGL, GOOG), Microsoft (MSFT), Amazon (AMZN), Meta (META), Tesla (TSLA), and Nvidia (NVDA)
3JPMorgan Guide to the Markets March 31, 2024
4Morningstar as of March 31, 2024
5JPMorgan Guide to the Markets March 31, 2024
6Morningstar as of March 31, 2024
Disclosures and Definitions
Comparisons to any indices referenced herein are for illustrative purposes only and are not meant to imply that actual returns or volatility will be similar to the indices. Indices cannot be invested in directly. Unmanaged index returns assume reinvestment of any and all distributions and do not reflect our fees or expenses.
• MSCI World captures large and mid-cap representation across 23 Developed Markets countries. With 1,645 constituents, the index covers approximately 85% of the free float-adjusted market capitalization in each country.
• Bloomberg U.S. Aggregate Index covers the U.S. investment grade fixed rate bond market, with index components for government and corporate securities, mortgage pass-through securities, and asset-backed securities.
• Bloomberg Global High Yield TR USD is a multi-currency flagship measure of the global high yield debt market. The index represents the union of the US High Yield, the Pan-European High Yield, and Emerging Markets (EM) Hard Currency High Yield Indices.
• The HFRI Asset Weighted Composite Index is a global, asset-weighted index comprised of single-manager funds that report to HFR Database. Constituent funds report monthly net of all fees performance in US Dollar and have a minimum of $50 Million under management or $10 Million under management and a twelve (12) month track record of active performance. The HFRI Asset Weighted Composite Index does not include Funds of Hedge Funds. The constituent funds of the HFRI Asset Weighted Composite Index are weighted according to the AUM reported by each fund for the prior month.
• HFRI Equity Hedge (Total) Index – Asset Weighted Index includes investment managers who maintain positions both long and short in primarily equity and equity derivative securities. A wide variety of investment processes can be employed to arrive at an investment decision, including both quantitative and fundamental techniques; strategies can be broadly diversified or narrowly focused on specific sectors and can range broadly in terms of levels of net exposure, leverage employed, holding period, concentrations of market capitalizations and valuation ranges of typical portfolios. EH managers would typically maintain at least 50% exposure to, and may in some cases be entirely invested in, equities, both long and short. The constituent funds of the HFRI Equity Hedge (Total) Index – Asset Weighted are weighted according to the AUM reported by each fund for prior month.
• HFRI Event-Driven (Total) Index – Asset Weighted Index includes Investment Managers who maintain positions in companies currently or prospectively involved in corporate transactions of a wide variety including but not limited to mergers, restructurings, financial distress, tender offers, shareholder buybacks, debt exchanges, security issuance or other capital structure adjustments. Security types can range from most senior in the capital structure to most junior or subordinated, and frequently involve additional derivative securities. Event Driven exposure includes a combination of sensitivities to equity markets, credit markets and idiosyncratic, company specific developments. Investment theses are typically predicated on fundamental characteristics (as opposed to quantitative), with the realization of the thesis predicated on a specific development exogenous to the existing capital structure. The constituent funds of the HFRI Event-Driven (Total) Index – Asset Weighted are weighted according to the AUM reported by each fund for prior month.
• HFRI Macro (Total) Index – Asset Weighted Index includes Investment Managers which trade a broad range of strategies in which the investment process is predicated on movements in underlying economic variables and the impact these have on equity, fixed income, hard currency and commodity markets. Managers employ a variety of techniques, both discretionary and systematic analysis, combinations of top down and bottom up theses, quantitative and fundamental approaches and long and short term holding periods. Although some strategies employ RV techniques, Macro strategies are distinct from RV strategies in that the primary investment thesis is predicated on predicted or future movements in the underlying instruments, rather than realization of a valuation discrepancy between securities. In a similar way, while both Macro and equity hedge managers may hold equity securities, the overriding investment thesis is predicated on the impact movements in underlying macroeconomic variables may have on security prices, as opposes to EH, in which the fundamental characteristics on the company are the most significant are integral to investment thesis. The constituent funds of the HFRI Macro (Total) Index – Asset Weighted are weighted according to the AUM reported by each fund for prior month.
• HFRI Relative Value (Total) Index – Asset Weighted Index includes Investment Managers who maintain positions in which the investment thesis is predicated on realization of a valuation discrepancy in the relationship between multiple securities. Managers employ a variety of fundamental and quantitative techniques to establish investment theses, and security types range broadly across equity, fixed income, derivative or other security types. Fixed income strategies are typically quantitatively driven to measure the existing relationship between instruments and, in some cases, identify attractive positions in which the risk adjusted spread between these instruments represents an attractive opportunity for the investment manager. RV position may be involved in corporate transactions also, but as opposed to ED exposures, the investment thesis is predicated on realization of a pricing discrepancy between related securities, as opposed to the outcome of the corporate transaction. The constituent funds of the HFRI Relative Value (Total) Index – Asset Weighted are weighted according to the AUM reported by each fund for prior month.
Material Risks Disclosures
Marketable Alternatives involves higher risk and is suitable only for sophisticated investors. Along with traditional market risks, marketable alternatives are also subject to higher fees, lower liquidity and the potential for leverage that may amplify volatility or the potential for loss of capital. Additionally, short selling involved certain risks including, but not limited to additional costs, and the potential for unlimited loss on certain short sale positions.
The information contained herein is confidential and the dissemination or distribution to any other person without the prior approval of Fiducient Advisors is strictly prohibited. Information has been obtained from sources believed to be reliable, though not independently verified. Any forecasts are hypothetical and represent future expectations and not actual return volatilities and correlations will differ from forecasts. This report does not represent a specific investment recommendation. The opinions and analysis expressed herein are based on Fiducient Advisor research and professional experience and are expressed as of the date of this report. Please consult with your advisor, attorney and accountant, as appropriate, regarding specific advice. Past performance does not indicate future performance and there is risk of loss.