Key Observations
• Target date offerings continued to garner the lion’s share of defined contribution assets and are now estimated to make up over 40% of the assets in 401(k)s.1
• Personalized target dates and dual-default solutions blending target dates and managed accounts have evolved.
• Managed account solutions continue to see increased adoption by Plan Sponsors, but participant utilization remains low.
Target Date Fund Utilization
Target date funds (TDF) remain the primary default solution offered by Plan Sponsors and continue to be the preferred investment option for participants, garnering the majority of contributions. Directionally, as communicated in last year’s Qualified Default Investment Alternative (QDIA) paper, the growth continues to increase in terms of percentage of plans offering target dates, as well as assets under management (AUM) for the solution. From a capital markets perspective, broad-based equities and fixed income asset classes rose in the 2023 calendar year, providing a tailwind to AUM growth; however, high participant contribution rates remain a key driver to the growth of these solutions.
Target date funds are the QDIA in 86.1% of plans, and 92.9% in plans with more than 5,000 participants, according to PSCA’s 66th Annual Survey 2023.2
Trends noted in 2022 continued throughout 2023. Passive target date solutions continue to garner the majority of assets, though blend/hybrid solutions (which include both active and passive underlying strategies) seem to be in the mix much more. While passive solutions are typically associated with lower expenses than blend or fully active counterparts, it is important to recognize that active decisions are made in any target date solution for the determination of strategic asset allocation, building blocks and objectives that the solutions are looking to address. As noted in last year’s paper:
There is not a single target date, not active nor passive, that is appropriate for all Plan Sponsors and their participants. While the Department of Labor (DOL) has provided guidance surrounding target date selection, there is no expectation that passive solutions or the cheapest solutions are the ones that Plan Sponsors should select. It is important for Plan Sponsors to understand that certain decisions made by a target date provider are in fact active in nature.
Collective Investment Trust (CIT) vehicles have also continued to gain traction, and their usage has become more apparent in mid- and small-market plans as well. These vehicles continue to attract interest within the institutional investing industry, in part due to their potential for lower fees, flexibility and improved transparency and reporting, lending to wider adoption not just for target dates, but across all offerings with plan menus.
Higher Equity = Higher Return (at least this year!)
It is no surprise that given market returns in 2023, solutions with higher equity glide paths generally produced higher absolute returns. While both broad-based equities and bonds rose in 2023, equities’ outperformance relative to fixed income was material. The S&P 500 Index rose 26.29% in 2023, while the Bloomberg U.S. Aggregate Index rose a modest 5.53%.3 There are numerous drivers of returns among QDIA solutions, however, total equity allocation is typically the primary driver of returns over a full market cycle. This is not to say that tactical asset management, sub-asset class exposure and underlying building block performance were not contributors, but 2023’s large dispersion between equity and bond returns certainly drove home the importance of considering strategic asset allocation in the TDF selection process.
While investors in higher equity solutions rejoiced in 2023, we are not far removed from a painful time for these same investors, as we experienced a nearly opposite market environment in 2022. This quick turnaround only further strengthens our view that Plan Sponsors (and participants) should be considering these investments with long-term time horizons, remembering the function and importance of the glidepath in helping to achieve retirement goals.
Lower Fees…Sort Of
Alongside the increased utilization of CITs in recent years for target date offerings, there has been a shift in fee structures. Historically, target date fund offerings had a range of expenses, typically based on the blended expenses of the underlying building blocks, with the vintages closest to retirement (greatest fixed income allocation) having lower fees, and the longer-dated vintages (greatest equity allocation) maintaining higher fees. However, unitized or “flat” fee structures are becoming more prominent within both CIT offerings and ’40 Act mutual funds. While the “average” expense ratio generally declines when money managers make the change from a range fee schedule to a flat fee schedule, it is important for Plan Sponsors to consider the specific impact their plan will experience with this change. The “average” expense might be the same or lower in the new structure for a provider and there could still be the potential for an increase in expense ratio on some of the vintages (typically those that were the least expensive before, which are the vintages near and in retirement). This can put Plan Sponsors in a precarious position. Although the change could result in overall savings for their plan, it can also cause increased expenses for some investors, while benefiting others. Working with an advisor or consultant can help to navigate this scenario, and of course having a prudent and documented process is paramount.
2024 Will be MY Year!
As we reflect on calendar year 2023, a common theme that has taken hold among providers of QDIA solutions is personalization. While the idea of a more personalized participant default solution has long existed, few solutions have actually entered the marketplace, and even fewer have been adopted by Plan Sponsors. Personalized target date solutions can come in various structures, but the general premise is building on the chassis of an off-the-shelf target date offering. However, unlike an off-the-shelf product which only considers a participant’s age alongside a number of generic assumptions, this new wave of personalized solutions can expand on available inputs, allowing for other data points to be incorporated into the asset allocation. Examples of these additional inputs may include salary, account balance, savings rate, risk-tolerance, etc., not unlike what we might expect to see in a managed account solution.
A handful of large off-the-shelf target date providers have launched a personalized solution in 2023 or have announced their intent to roll one out in the near-term, while additional providers reference it as a research initiative for their respective organizations. While the overarching solutions are similar in concept, the operational aspects can vary. Type of vehicle, recordkeeper availability and building block construction are all areas where these solutions can differ on top of the obvious investment difference, and it is these operational complexities that could ultimately lead to headwinds for broad adoption within the industry.
Managed Accounts Broadly Offered
Managed accounts have become much more commonplace among defined contribution plans in recent years. A number of tailwinds are at play for this trend, including potential improved offerings and reduced fees, greater push from recordkeepers, Plan Sponsors’ desire for retirement income solutions and a greater willingness among participants to utilize digital and online tools.
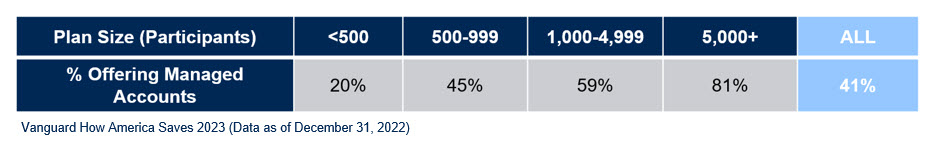
Availability of managed accounts has increased from 30% of plans in 2018 to 41% of plans in 2022. Larger plans (5,000+ participants) are more likely to offer managed accounts, while smaller plans (<500 participants) are less likely to offer this service.4
While managed accounts are not a new solution in 2023 (as these have been around for over 20 years) there was continued interest and growth in such solutions during the calendar year, and we would not anticipate this trend slowing down in the near future. A recent article by PLANADVISER notes that while utilization with Plan Sponsors has increased, the actual participant assets in these managed account solutions is still dwarfed by the assets in target dates.
“Although managed accounts are now 20 years old, actual assets within them are still relatively small. Cerulli Associates, which tracks the account assets managed by the top nine DC providers, shows a market of $434.57 billion, as of the second quarter of 2023. As a comparison, the top 10 target-date funds in DC plans accounted for $1.74 trillion in assets at the end of 2023, according to Simfund.”5
Closing Thoughts
Whether it be off-the-shelf target date solutions, managed accounts or some personalized solution blending the two, the QDIA landscape continues to evolve. As the lion’s share of participant money continues to flow into default solutions (either by choice or by default), it is likely a space that will see further evolution. Key themes appear constant, regardless of structure, as the pressure remains to reduce fees, address different demographics and provide more customized solutions to participants.
If you would like to learn more about this topic, please reach out to any of the professionals at Fiducient Advisors.
1How America Saves, Vanguard, 2023
2PSCA 66th Annual Survey 2023. Data as of December 31, 2022
3Fiducient Advisors as of December 29, 2023. See disclosures for list of indices representing each asset class. Past performance does not indicate future performance and there is a possibility of a loss. Indices cannot be invested in directly.
4How America Saves, Vanguard, 2023
5Managed Accounts, by the Numbers, PLANADVISER, February 1, 2024
Disclosures & Definitions
Comparisons to any indices referenced herein are for illustrative purposes only and are not meant to imply that actual returns or volatility will be similar to the indices. Indices cannot be invested in directly. Unmanaged index returns assume reinvestment of any and all distributions and do not reflect our fees or expenses.
- The S&P 500 Index is a capitalization-weighted index designed to measure performance of the broad domestic economy through changes in the aggregate market value of 500 stocks representing all major industries.
- Bloomberg U.S. Aggregate Index covers the U.S. investment grade fixed rate bond market, with index components for government and corporate securities, mortgage pass-through securities, and asset-backed securities.
Material Risk Disclosures
Fixed Income securities are subject to interest rate risks, the risk of default and liquidity risk. U.S. investors exposed to non-U.S. fixed income may also be subject to currency risk and fluctuations.
Domestic Equity can be volatile. The rise or fall in prices take place for a number of reasons including, but not limited to changes to underlying company conditions, sector or industry factors, or other macro events. These may happen quickly and unpredictably.
The information contained herein is confidential and the dissemination or distribution to any other person without the prior approval of Fiducient Advisors is strictly prohibited. Information has been obtained from sources believed to be reliable, though not independently verified. Any forecasts are hypothetical and represent future expectations and not actual return volatilities and correlations will differ from forecasts. This report does not represent a specific investment recommendation. The opinions and analysis expressed herein are based on Fiducient Advisor research and professional experience and are expressed as of the date of this report. Please consult with your advisor, attorney and accountant, as appropriate, regarding specific advice. Past performance does not indicate future performance and there is risk of loss.