All eyes remain on Congress as the June “x-date” approaches
Key Observations
• Market volatility persisted in May as investors try to digest potential Fed policy action in June and the possibility of a U.S. default should a deal not be reached to raise the debt limit.
• Significant progress toward a debt ceiling agreement was made in eleventh hour of the month.
• Most market indexes posted negative returns, with limited bright spots in growth-oriented segments.
• Short-term rates remain higher than long-term and the U.S. yield curve remains inverted. Cash rates look attractive, but tactically timing the market based on yield ignores other factors when allocating fixed income assets.
Market Recap
We’ve highlighted our theme of persistent heightened market volatility in many of our market reviews this year and May continued to deliver on that premise. Financial markets finally started to digest the regional banking turmoil from earlier in the year, a better-than-expected earnings season and a concentrated growth rally fueled by optimism in the AI industry helped propel U.S. equities for the first half of the month.
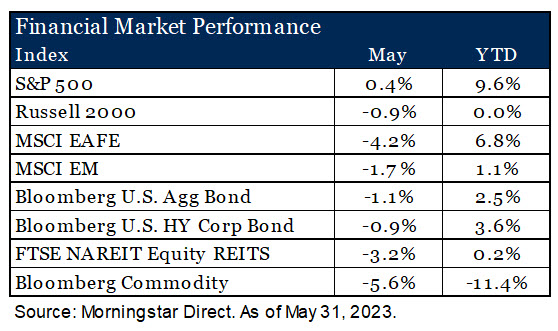
However, as the month progressed, concerns of the U.S. Treasury running out of money in June heated up and a shift in sentiment to more hawkish Fed actions to come stalled markets. Economic data trended a bit lower with weaker manufacturing PMI numbers reported from China and the U.S., increasing investor concerns of slower economic activity in the back half of the year and fueling the selloff in equities toward the end of the month. A stronger dollar was an additional headwind for non-U.S. investments. More economically sensitive areas such as REITs and commodities also came under pressure. REITs continue to be driven lower by the office segment while a reduced outlook for global demand weighed on commodity prices.
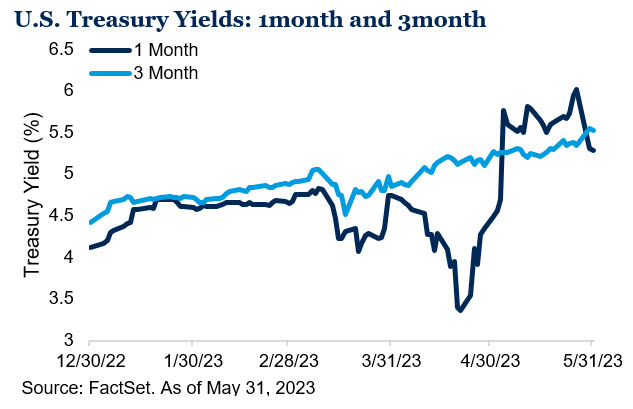
Fixed income markets were negatively impacted by rising interest rates and additional volatility on the front end of the U.S. yield curve was sparked by growing concerns of potential default if Congress does not come to an agreement to raise the debt limit. The yield on 1-month Treasury bills spiked early in the month as a result, but settled back as negotiations took an optimistic turn for a deal to be reached by the June 5 “x-date” in the last few days of the month.
Is Cash the Best Place to Be?
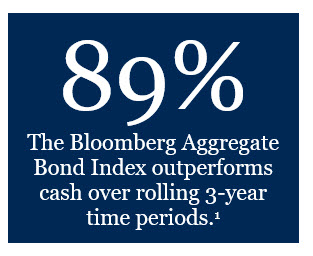
The U.S. yield curve remains inverted as investors are more concerned about economic risks in the near-term than the long-term. In the current interest rate environment – short-term rates higher than long-term rates – there are many wondering “why invest in longer duration assets when cash yields more?” At the surface the answer seems obvious, invest in the higher yielding asset, but there are more factors to consider than just yield itself. Time horizon and the investment objective for the assets, to name a few, are other important elements to evaluate. Cash can certainly have a place in portfolios for investors that have short-term needs where protecting principal is paramount but, for a more typical horizon over multiple years, cash often proves suboptimal as bonds tend to provide higher total returns over the long-term. In fact, since 1978, the Bloomberg Aggregate Bond Index outperforms cash (as measured by the ICE BofA US 3M TBill Index) approximately 67% of the time on a rolling 1-year basis and that figure jumps to 89% if we expand the rolling period to three years.1
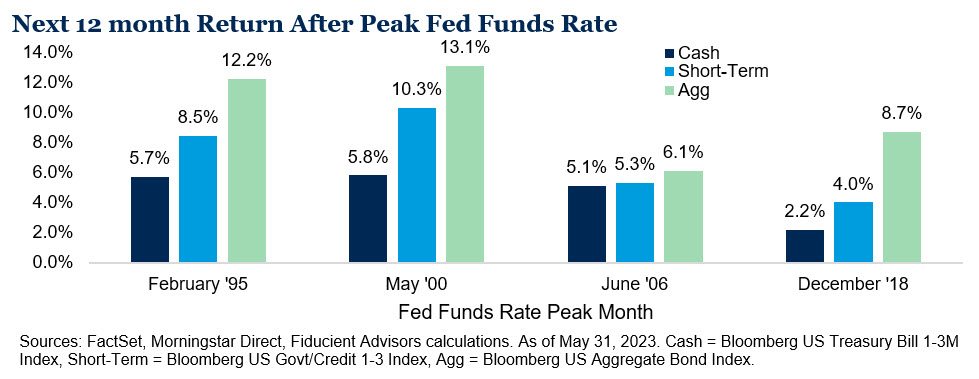
If positioning in cash is less focused on the long-term and more about the potential change in interest rates, we would also suggest evaluating that stance. We do not believe in timing interest rates, but we feel we are closer to the end of this interest rate hiking cycle than the beginning. Historically the prospects for traditional fixed income compared to cash when rates peak looks appealing. Following the month of the peak Fed Funds Rate, longer duration fixed income assets have outperformed cash over the following year, often by a wide margin.
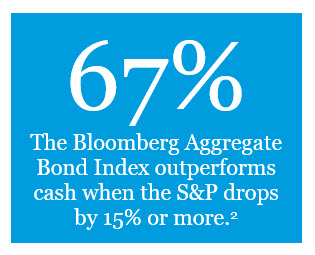
Finally, in our April Market Review we highlighted the growing risk of economic contraction. Having exposure to high quality duration may be beneficial in a flight to quality environment to help diversify the portfolio. Since 1990, bonds have outperformed cash 67% of the time if the S&P 500 Index falls 15% or more peak-to-trough, with an average margin of outperformance of 1.6%.2 We often say cash is good at protecting itself since it is stable in both up and down markets. However, bonds may be better at protecting the portfolio as they have often performed their best when risk assets perform their worst.
Outlook
Uncertainty is a large underpinning of what drives volatility in markets. With the passing of a debt ceiling agreement now imminent, the rising prospect of a slowing business cycle is now at the forefront of investors’ minds. Our views and themes of continued volatility as we move into a new interest rate regime and moderating inflation remain intact. We believe our long-term strategic views and positioning updates at the beginning of the year reinforce the foundations of our portfolios as we move into the back half of the year in an environment with tighter financial conditions.
For more information, please contact any of the professionals at Fiducient Advisors.
1Morningstar Direct, Fiducient Advisors calculations. As of May 31, 2023.
2FactSet, Yardeni Research, Morningstar Direct, Fiducient Advisors calculations. Data from January 1990 to October 2022.
Disclosures & Definitions
Comparisons to any indices referenced herein are for illustrative purposes only and are not meant to imply that actual returns or volatility will be similar to the indices. Indices cannot be invested in directly. Unmanaged index returns assume reinvestment of any and all distributions and do not reflect our fees or expenses.
- The S&P 500 is a capitalization-weighted index designed to measure performance of the broad domestic economy through changes in the aggregate market value of 500 stocks representing all major industries.
- Russell 2000 consists of the 2,000 smallest U.S. companies in the Russell 3000 index.
- MSCI EAFE is an equity index which captures large and mid-cap representation across Developed Markets countries around the world, excluding the U.S. and Canada. The index covers approximately 85% of the free float-adjusted market capitalization in each country.
- MSCI Emerging Markets captures large and mid-cap representation across Emerging Markets countries. The index covers approximately 85% of the free-float adjusted market capitalization in each country.
- Bloomberg U.S. Aggregate Index covers the U.S. investment grade fixed rate bond market, with index components for government and corporate securities, mortgage pass-through securities, and asset-backed securities.
- Bloomberg U.S. Corporate High Yield Index covers the universe of fixed rate, non-investment grade debt. Eurobonds and debt issues from countries designated as emerging markets (sovereign rating of Baa1/BBB+/BBB+ and below using the middle of Moody’s, S&P, and Fitch) are excluded, but Canadian and global bonds (SEC registered) of issuers in non-EMG countries are included.
- FTSE NAREIT Equity REITs Index contains all Equity REITs not designed as Timber REITs or Infrastructure REITs.
- Bloomberg Commodity Index is calculated on an excess return basis and reflects commodity futures price movements. The index rebalances annually weighted 2/3 by trading volume and 1/3 by world production and weight-caps are applied at the commodity, sector and group level for diversification.
- Bloomberg 1-3 Month U.S. Treasury Bill Index is designed to measure the performance of public obligations of the U.S. Treasury that have a remaining maturity of greater than or equal to 1 month and less than 3 months.
- Bloomberg US Govt/Credit 1-3 Index is the 1-3 year component of the Bloomberg U.S. Government/Credit index, which includes securities in the Government and Credit Indices. The Government Index includes treasuries and agencies, while the credit index includes publicly issued U.S. corporate and foreign debentures and secured notes that meet specified maturity, liquidity, and quality requirements.
- ICE BofA US 3M Tbill Index is an unmanaged index that is comprised of a single U.S. Treasury issue with approximately three months to final maturity, purchased at the beginning of each month and held for one full month.
Material Risks
- Fixed Income securities are subject to interest rate risks, the risk of default and liquidity risk. U.S. investors exposed to non-U.S. fixed income may also be subject to currency risk and fluctuations.
- Cash may be subject to the loss of principal and over longer periods of time may lose purchasing power due to inflation.
- Domestic Equity can be volatile. The rise or fall in prices take place for a number of reasons including, but not limited to changes to underlying company conditions, sector or industry factors, or other macro events. These may happen quickly and unpredictably.
- International Equity can be volatile. The rise or fall in prices take place for a number of reasons including, but not limited to changes to underlying company conditions, sector or industry impacts, or other macro events. These may happen quickly and unpredictably. International equity allocations may also be impact by currency and/or country specific risks which may result in lower liquidity in some markets.
The information contained herein is confidential and the dissemination or distribution to any other person without the prior approval of Fiducient Advisors is strictly prohibited. Information has been obtained from sources believed to be reliable, though not independently verified. Any forecasts are hypothetical and represent future expectations and not actual return volatilities and correlations will differ from forecasts. This report does not represent a specific investment recommendation. The opinions and analysis expressed herein are based on Fiducient Advisor research and professional experience and are expressed as of the date of this report. Please consult with your advisor, attorney and accountant, as appropriate, regarding specific advice. Past performance does not indicate future performance and there is risk of loss.