As the party keeps going, how important are all-time highs?
Key Observations
- Q3 is on track to deliver a fourth straight quarter of double-digit earnings growth. The Fed’s October rate cut added momentum to already strong 2025 performance.
- The 0.25% cut was expected, but the tone surprised. Hawkish dissent and Powell’s remarks shifted sentiment. Futures markets dropped from a 94% chance of a December cut to
69% post-meeting. - Supportive macroeconomic conditions have propelled markets to new all-time highs. To understand the implications, consider the following context:
- Headline index price offers limited insight. If a headline touts an ‘all-time high’, move on to something more insightful.
- Valuations are more telling. While they don’t predict 2026 outcomes, elevated valuations warrant attention and may signal future volatility.
- Record concentration within the S&P 500 intensifies existing dynamics. A narrow leadership amplifies both risk and opportunity, making diversification and selectivity more critical.
Market Recap
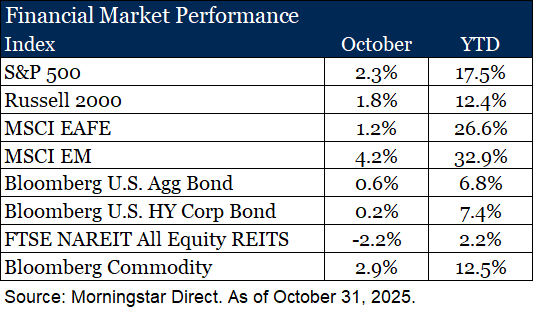
The rally continued in October, fueled by persistent optimism about artificial intelligence, ongoing rate cuts from the Federal Reserve and robust third-quarter earnings. As of October 31, 64% of S&P 500 companies had reported earnings, with blended earnings growth at 10.7%1. If the quarter closes above 10%, it will mark the fourth consecutive quarter of double-digit earnings growth.
U.S. equities moved higher, with the S&P 500 gaining 2.3%. Technology stocks led the advance, propelled by robust earnings and sustained enthusiasm for AI. This powerful tailwind aided in growth stocks outperforming value stocks during the month. Small caps rose 1.8%, though their pace moderated after a strong third quarter.
Overseas, developed markets posted modest gains, constrained by sluggish growth in Europe and Japan. Emerging markets outperformed, buoyed by China’s targeted stimulus and a temporary easing of U.S.-China trade tensions. South Korea stood out, adding to its nearly 100% year-to-date gain. Investor excitement around Samsung Electronics, the country’s largest publicly traded company, played a key role in driving returns.
Bond markets rallied as yields declined, reflecting continued central bank easing. Although the 0.25% rate cut was widely anticipated, hawkish dissent and Chairman Powell’s remarks on the balance of risks caught investors off guard. Futures markets, which had priced in a 94% probability of a December cut before the meeting, dropped to 67% after2.
Commodities delivered mixed results. Gold, while up for the month, experienced its largest single-day decline in several years, losing some of its shine amid shifting rate expectations.
Overall, asset prices moved higher, fueled by continued optimism. This brings us to the topic of “highs”. Markets have been hitting quite a few of them lately. Headlines celebrate record-breaking numbers, but it is worth asking: what do these “highs” actually mean? In the sections that follow, we will explore three new all-time highs; price, valuation and concentration, to better understand the implications for investors.
Price
Financial media loves a milestone. “S&P Hits Record High!”, “Dow Tops 47,000!”. These headlines grab attention, but they rarely offer insight. Price alone is just a number. It is like hearing someone has paid $40 for dinner without knowing what they ordered. If it was grilled cheese and tap water, that is steep! If it was a prime steak and a great glass of wine, maybe it was a bargain. The same logic applies to markets. Price tells us what something costs, but not what it is worth. And historically, new highs in price alone have shown little predictive power. They’re psychological markers, not reliable signals.
Valuation
Valuation, on the other hand, measures what we receive for the price we pay. In equity markets, that’s earnings per share. When we buy a stock, we are purchasing a claim on future earnings, or the economic value a business generates. If those earnings grow, the price may follow, and we are rewarded through higher returns.
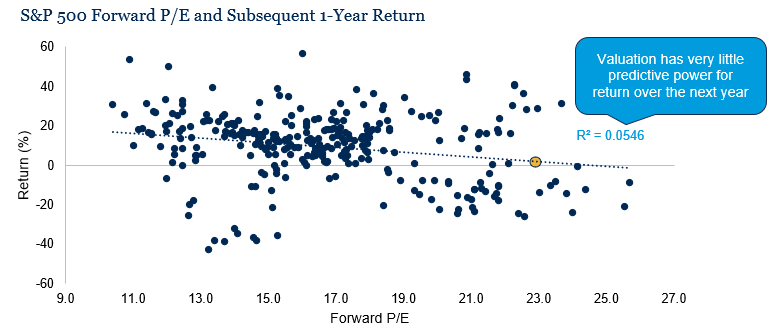
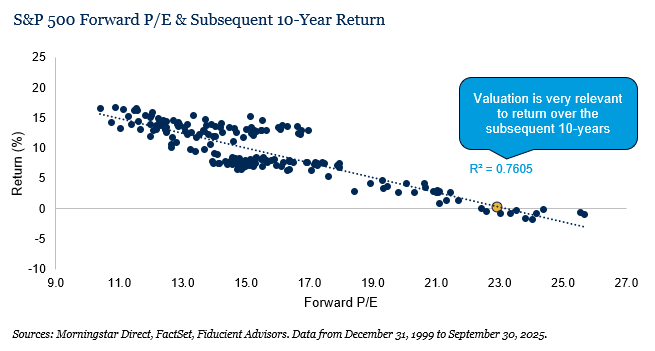
Low valuations often reflect modest expectations, which can create upside. High valuations, on the other hand, imply optimism. That optimism raises the bar and risk the investment fails to deliver. Valuation is not a perfect predictor, however. The biggest nuance is time. In the short term, valuation has little influence on how a stock trades next month, quarter or year. However, extend the horizon, and the picture changes. Over longer periods, valuation become far more meaningful to future outcomes.
Sources: Morningstar Direct, FactSet, Fiducient Advisors. Data from December 31, 1999 to September 30, 2025.
Today, markets are expensive by nearly every measure. What does that mean for 2026? As evidenced above, not much. But for long-term investors, it matters a great deal. High valuations call for deliberate risk management, thoughtful diversification, and a clear plan for what to do if prices fall.
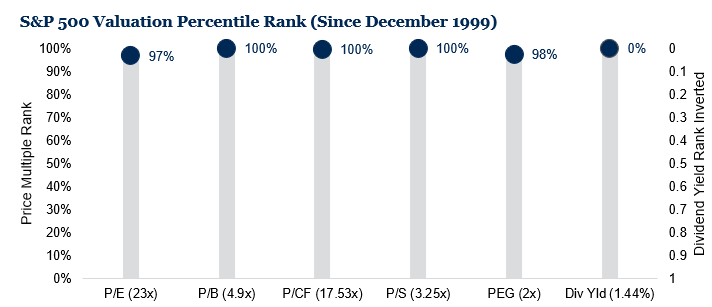
Source: FactSet. As of October 31, 2025. P/E = next twelve months price-to-earnings ratio, P/B = next twelve months price-to-book, P/CF = next twelve months price-to-cash flow, P/S = next twelve months price-to-sales, PEG = next twelve months P/E-to-growthDiv Yld = next twelve months dividend yield. Dividend yield inverted on axis.
Concentration
The S&P 500 is also reaching record levels of concentration. As of October 31, 2025, the top 10 stocks account for 40.2%1 of the index, an all-time high. Unlike price or valuation, concentration does not stand alone, it amplifies what is already there. Think of it like leverage. When things go well, it boosts returns. When they go poorly, it magnifies losses.
Since 1991, markets with above average concentration saw intra-year max drawdowns that were over 5% larger than below average concentration (-7.7% vs -12.9%)1. This concept is perhaps best exemplified by a sports team. A team built around one star player might shine, but it is less resilient than one with a deep bench. Today, AI is that star player, driving a handful of stocks to new highs. But the more concentrated the market becomes, the more fragile it may be. As concentration climbs, it intensifies the risks tied to high valuations. That’s why we believe it is more important than ever to stay intentional; manage risk, diversify wisely and prepare for what comes next.
1FactSet as of October, 31 2025
2CME Fed Watch Tool as of November 3, 2025
Disclosures & Definitions
Comparisons to any indices referenced herein are for illustrative purposes only and are not meant to imply that actual returns or volatility will be similar to the indices. Indices cannot be invested in directly. Unmanaged index returns assume reinvestment of any and all distributions and do not reflect our fees or expenses. Market returns shown in text are as of the publish date and source from Morningstar or FactSet unless otherwise listed.
- The S&P 500 is a capitalization-weighted index designed to measure performance of the broad domestic economy through changes in the aggregate market value of 500 stocks representing all major industries.
- Russell 2000 consists of the 2,000 smallest U.S. companies in the Russell 3000 index.
- MSCI EAFE is an equity index which captures large and mid-cap representation across Developed Markets countries around the world, excluding the U.S. and Canada. The index covers approximately 85% of the free float-adjusted market capitalization in each country.
- MSCI Emerging Markets captures large and mid-cap representation across Emerging Markets countries. The index covers approximately 85% of the free-float adjusted market capitalization in each country.
- Bloomberg U.S. Aggregate Index covers the U.S. investment grade fixed rate bond market, with index components for government and corporate securities, mortgage pass-through securities, and asset-backed securities.
- Bloomberg U.S. Corporate High Yield Index covers the universe of fixed rate, non-investment grade debt. Eurobonds and debt issues from countries designated as emerging markets (sovereign rating of Baa1/BBB+/BBB+ and below using the middle of Moody’s, S&P, and Fitch) are excluded, but Canadian and global bonds (SEC registered) of issuers in non-EMG countries are included.
- FTSE NAREIT Equity REITs Index contains all Equity REITs not designed as Timber REITs or Infrastructure REITs.
- Bloomberg Commodity Index is calculated on an excess return basis and reflects commodity futures price movements. The index rebalances annually weighted 2/3 by trading volume and 1/3 by world production and weight-caps are applied at the commodity, sector and group level for diversification.
Material Risks
- Fixed Income securities are subject to interest rate risks, the risk of default and liquidity risk. U.S. investors exposed to non-U.S. fixed income may also be subject to currency risk and fluctuations.
- Cash may be subject to the loss of principal and over longer periods of time may lose purchasing power due to inflation.
- Domestic Equity can be volatile. The rise or fall in prices take place for a number of reasons including, but not limited to changes to underlying company conditions, sector or industry factors, or other macro events. These may happen quickly and unpredictably.
- International Equity can be volatile. The rise or fall in prices take place for a number of reasons including, but not limited to changes to underlying company conditions, sector or industry impacts, or other macro events. These may happen quickly and unpredictably. International equity allocations may also be impacted by currency and/or country specific risks which may result in lower liquidity in some markets.
- Real Assets can be volatile and may include asset segments that may have greater volatility than investment in traditional equity securities. Such volatility could be influenced by a myriad of factors including, but not limited to overall market volatility, changes in interest rates, political and regulatory developments, or other exogenous events like weather or natural disaster.
- Private Real Estate involves higher risk and is suitable only for sophisticated investors. Real estate assets can be volatile and may include unique risks to the asset class like leverage and/or industry, sector or geographical concentration. Declines in real estate value may take place for a number of reasons including, but are not limited to economic conditions, change in condition of the underlying property or defaults by the borrower.
- All investing involves risk including the potential loss of principal. Market volatility may significantly impact the value of your investments. Recent tariff announcements may add to this volatility, creating additional economic uncertainty and potentially affecting the value of certain investments. Tariffs can impact various sectors differently, leading to changes in market dynamics and investment performance. You should consider these factors when making investment decisions. We recommend consulting with a qualified financial adviser to understand how these risks may affect your portfolio and to develop a strategy that aligns with your financial goals and risk tolerance.
The information contained herein is confidential and the dissemination or distribution to any other person without the prior approval of Fiducient Advisors is strictly prohibited. Information has been obtained from sources believed to be reliable, though not independently verified. Any forecasts are hypothetical and represent future expectations and not actual return volatilities and correlations will differ from forecasts. This report does not represent a specific investment recommendation. The opinions and analysis expressed herein are based on Fiducient Advisor research and professional experience and are expressed as of the date of this report. Please consult with your advisor, attorney and accountant, as appropriate, regarding specific advice. Past performance does not indicate future performance and there is risk of loss.