

Market leadership broadened even as inflation, rates and geopolitical risks weighed on sentiment
Key Observations
• July was a volatile month as investors weighed strong corporate earnings against renewed concerns about AI-related valuations, heavy capital spending, and the durability of the recent growth-led rally.
• The Federal Reserve held rates steady at 3.50% to 3.75%, but three dissents in favor of a hike and a continued focus on elevated inflation pushed Treasury yields higher and pressured rate-sensitive areas of the market.
• Market leadership continued to broaden as value-oriented sectors, real assets, and select non-U.S. equities held up better than mega-cap growth, while Middle East tensions and higher oil prices reinforced the importance of diversified portfolio exposures.
Market Recap
July served as a reminder that markets continue to navigate a complex environment where economic resilience, persistent inflation pressures, evolving monetary expectations, and geopolitical developments all compete for investor attention. An escalation in tensions involving Iran contributed to higher energy prices and increased volatility late in the month, while investors also digested another Federal Reserve meeting with mixed signals and lack of clarity on the direction of policy. The Federal Open Market Committee voted to keep the federal funds rate unchanged at 3.50% to 3.75%, though a notable number of policymakers favored tighter policy, leading Treasury yields to move higher and weighing on interest rate sensitive asset classes.
U.S. equities finished modestly lower but performance broadened beneath the surface. The S&P 500 declined 0.1% for the month, giving back a portion of its strong year-to-date gains, while the Russell 2000 fell 3.0% as rising bond yields and tighter financial conditions created a headwind for smaller cap companies. The market’s leadership continued to rotate away from some of the largest growth-oriented stocks that had led earlier in the year, while investors favored sectors tied to energy, financials and more value-oriented areas of the market.
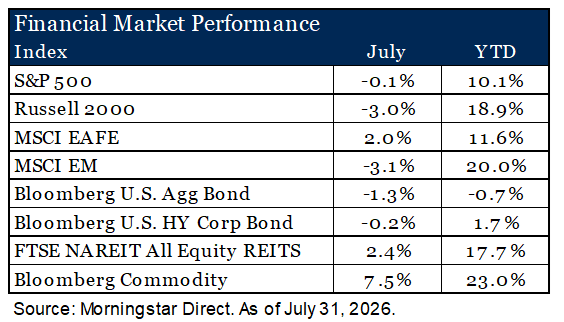
International developed equities delivered positive results despite the uncertain environment. The MSCI EAFE Index gained 2.0%, supported by strength across parts of Europe and the United Kingdom, where equity markets benefited from relatively attractive valuations. A weaker U.S. dollar also provided a modest tailwind for U.S.-based investors. Emerging markets faced a more difficult month. The MSCI Emerging Markets Index declined 3.1%, driven largely by weakness in several technology-heavy Asian markets as investors reassessed growth expectations and semiconductor-related shares experienced a significant pullback after a strong first half of the year.
Fixed income markets struggled as yields moved higher following the July FOMC meeting. The Bloomberg U.S. Aggregate Bond Index fell 1.3%, reflecting pressure across both Treasury and investment-grade corporate bonds. The market had mixed interpretation of the Fed’s messaging, particularly with inflation remaining above target and energy prices rising amid Middle East tensions. Credit markets proved relatively resilient. The Bloomberg U.S. Corporate High Yield Index slipped just 0.2%, as healthy corporate fundamentals and limited default activity helped offset the impact of rising rates.
Real assets were among the strongest performers during the month. The FTSE NAREIT All Equity REITs Index gained 2.4%, supported by continued strength in data center, industrial and specialized property sectors. Commodities delivered the best performance among major asset classes, with the Bloomberg Commodity Index rising 7.5%.
Small Cap Equities Providing Diversification Benefit
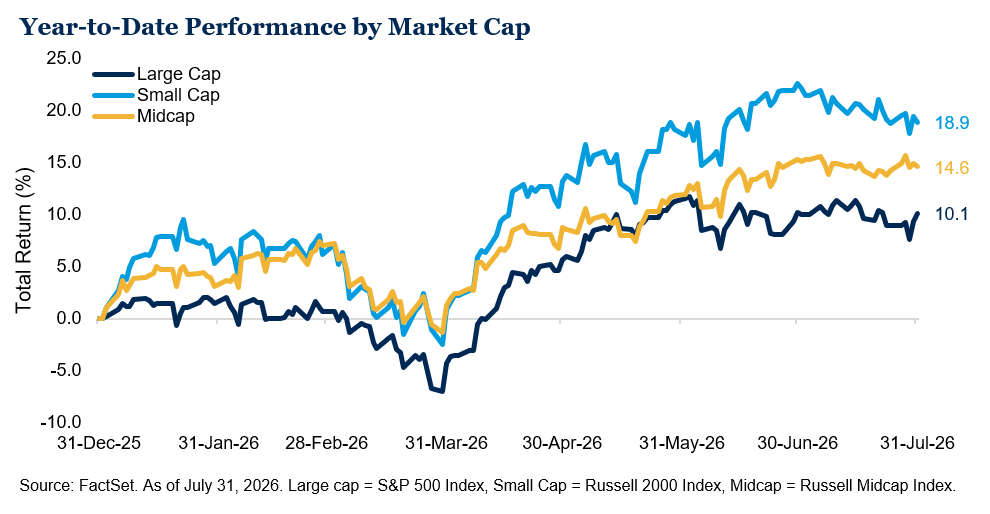
We highlighted in our 2026 Outlook the growing concern of AI concentration and elevated valuations within the U.S. large cap equity market. As part of our AI Playbook, we advocated for diversifying positions in portfolios, such as small and mid-cap U.S. equity exposure, as well as non-U.S. equity positions. We believed these companies would be a part of the AI flywheel, benefitting from the use of AI, despite not being the direct builders of AI. Attractive relative valuations of small cap relative to large further supported the case for allocating. Enthusiasm for AI has been a tremendous tailwind for many large cap companies, but growing concerns about valuations and the path to monetization of extreme capex spending has put pressure on some of the mega cap names that have led the market over recent years. Seven months into the year, we have been rewarded for having these diversified exposures within portfolios as small- and mid-cap stocks are up 18.9% and 14.6%, respectively, compared to large-cap up 10.1%.
Despite Strength in the Asset Class, Active Small Cap Has Lagged
While the decision to allocate to small cap has been a boon for portfolios this year, active management within the space has struggled of late. As we discussed in our recent Active vs. Passive white paper (and iterations prior), the small cap space is an area where active management has shown to have efficacy – a greater probability of outperforming the index and with a higher average excess return.1 We continue to support active small cap, however, over the last year, active management has struggled, with the index ranking in the top quartile of the small blend peer group.2
While active managers typically go through periods of underperformance, let’s take a deeper look as to factors that may be driving the recent results. There was a major shift in small cap leadership over the past year and a sharp rebound in unprofitable companies, a dynamic that has created a difficult backdrop for many active managers focused on quality and durable earnings.
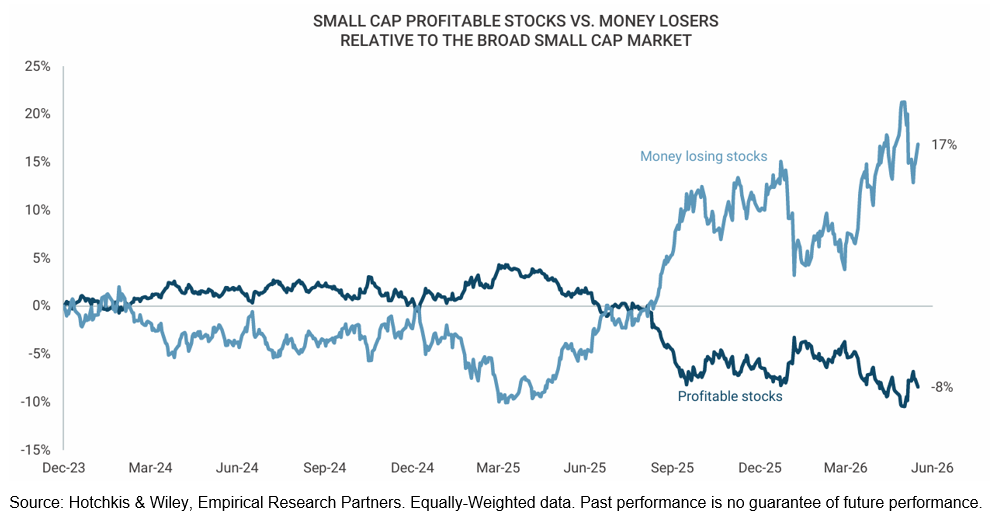
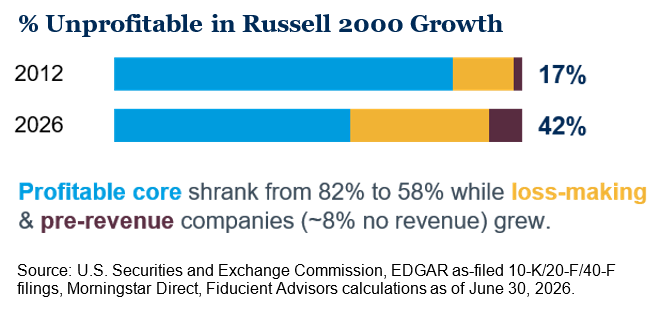
The small cap growth asset class has been particularly impacted by this trend as the number of profitable companies making up the index fell from approximately 82% in 2012 to just 58% in 2026.3 This shift in market leadership compounded by the growth in non-profitable companies was a large detractor for active management over the past year. We do not view this as a reason to abandon active small cap exposure, but it does argue for patience, manager selectivity and a clear understanding of what is driving short-term relative performance.
Outlook
This year has reinforced the importance of remaining diversified as market leadership continued to broaden beyond the largest U.S. companies. The strong relative performance of small and mid-cap equities year to date supports a key theme from our 2026 Outlook: investors do not need to rely solely on the largest AI beneficiaries to participate in the next phase of the cycle. As AI-related investment spreads across the economy, smaller companies, non-U.S. equities and real assets may all play a role in capturing a broader set of opportunities. With valuations still elevated in parts of the market, interest rates elevated and geopolitical risks unresolved, we continue to favor balanced portfolios that can participate in broadening market leadership while maintaining exposure to high-quality managers and diversifying asset classes. For a deeper look at the themes shaping markets and the economy for the remainder of the year, we encourage readers to explore our Mid-Year Outlook.
1 Fiducient Advisors, The Next Chapter in the Active vs. Passive Debate. As of May 30, 2026.
2 Morningstar Direct. Russell 2000 Index rank in the Morningstar Small Cap Blend Peer Group as of July 31, 2026.
3 Source: U.S. Securities and Exchange Commission, EDGAR as-filed 10-K/20-F/40-F filings, Morningstar Direct, Fiducient Advisors calculations as of June 30, 2026.
Disclosures & Definitions
Comparisons to any indices referenced herein are for illustrative purposes only and are not meant to imply that actual returns or volatility will be similar to the indices. Indices cannot be invested in directly. Unmanaged index returns assume reinvestment of any and all distributions and do not reflect our fees or expenses. Market returns shown in text are as of the publish date and source from Morningstar or FactSet unless otherwise listed.
- The S&P 500 is a capitalization-weighted index designed to measure performance of the broad domestic economy through changes in the aggregate market value of 500 stocks representing all major industries.
- Russell 2000 consists of the 2,000 smallest U.S. companies in the Russell 3000 index.
- Russell 2000 Growth measures the performance of the Russell 2000 companies with higher P/B ratios and higher forecasted growth values.
- MSCI EAFE is an equity index which captures large and mid-cap representation across Developed Markets countries around the world, excluding the U.S. and Canada. The index covers approximately 85% of the free float-adjusted market capitalization in each country.
- MSCI Emerging Markets captures large and mid-cap representation across Emerging Markets countries. The index covers approximately 85% of the free-float adjusted market capitalization in each country.
- Bloomberg U.S. Aggregate Index covers the U.S. investment grade fixed rate bond market, with index components for government and corporate securities, mortgage pass-through securities, and asset-backed securities.
- Bloomberg U.S. Corporate High Yield Index covers the universe of fixed rate, non-investment grade debt. Eurobonds and debt issues from countries designated as emerging markets (sovereign rating of Baa1/BBB+/BBB+ and below using the middle of Moody’s, S&P, and Fitch) are excluded, but Canadian and global bonds (SEC registered) of issuers in non-EMG countries are included.
- FTSE NAREIT Equity REITs Index contains all Equity REITs not designed as Timber REITs or Infrastructure REITs.
- Bloomberg Commodity Index is calculated on an excess return basis and reflects commodity futures price movements. The index rebalances annually weighted 2/3 by trading volume and 1/3 by world production and weight-caps are applied at the commodity, sector and group level for diversification.
Material Risks
- Fixed Income securities are subject to interest rate risks, the risk of default and liquidity risk. U.S. investors exposed to non-U.S. fixed income may also be subject to currency risk and fluctuations.
- Cash may be subject to the loss of principal and over longer periods of time may lose purchasing power due to inflation.
- Domestic Equity can be volatile. The rise or fall in prices take place for a number of reasons including, but not limited to changes to underlying company conditions, sector or industry factors, or other macro events. These may happen quickly and unpredictably.
- International Equity can be volatile. The rise or fall in prices take place for a number of reasons including, but not limited to changes to underlying company conditions, sector or industry impacts, or other macro events. These may happen quickly and unpredictably. International equity allocations may also be impacted by currency and/or country specific risks which may result in lower liquidity in some markets.
- Real Assets can be volatile and may include asset segments that may have greater volatility than investment in traditional equity securities. Such volatility could be influenced by a myriad of factors including, but not limited to overall market volatility, changes in interest rates, political and regulatory developments, or other exogenous events like weather or natural disaster.
- Private Real Estate involves higher risk and is suitable only for sophisticated investors. Real estate assets can be volatile and may include unique risks to the asset class like leverage and/or industry, sector or geographical concentration. Declines in real estate value may take place for a number of reasons including, but are not limited to economic conditions, change in condition of the underlying property or defaults by the borrower.
- All investing involves risk including the potential loss of principal. Market volatility may significantly impact the value of your investments. Recent tariff announcements may add to this volatility, creating additional economic uncertainty and potentially affecting the value of certain investments. Tariffs can impact various sectors differently, leading to changes in market dynamics and investment performance. You should consider these factors when making investment decisions. We recommend consulting with a qualified financial adviser to understand how these risks may affect your portfolio and to develop a strategy that aligns with your financial goals and risk tolerance.
The information contained herein is confidential and the dissemination or distribution to any other person without the prior approval of Fiducient Advisors is strictly prohibited. Information has been obtained from sources believed to be reliable, though not independently verified. Any forecasts are hypothetical and represent future expectations and not actual return volatilities and correlations will differ from forecasts. This report does not represent a specific investment recommendation. The opinions and analysis expressed herein are based on Fiducient Advisor research and professional experience and are expressed as of the date of this report. Please consult with your advisor, attorney and accountant, as appropriate, regarding specific advice. Past performance does not indicate future performance and there is risk of loss.