After an unusual start to 2020, the second half of the year seemed more like prior years in terms of recent activity and pace for fundraising; transaction activity; and exits across private markets. Purchase multiples and debt multiples (relative to EBITDA) continued to expand, largely taking their lead from public markets, which continued to rise. As we move into 2021, competition around allocations remains relatively high and time spent fundraising has shrunk.
As with most asset classes in 2020, private markets were a tale of two halves. The pandemic caused severe market dislocation and activity froze the first half of the year while investors tried their best to navigate the crisis. Despite some lack of clarity concerning the duration and overall severity of the COVID-19 pandemic, private markets managers adapted to the situation in the second half of the year and showed resilience.
Notwithstanding the upheaval of professional and personal lives, many professionals quickly acclimated to a new way of conducting business. Both General Partners (“GPs”) and Limited Partners (“LPs”) embraced technology to conduct meetings, persist with due diligence and eventually engage in new deal activity. Internally, Fiducient Advisors spent a significant amount of time talking with GPs about when and how they moved from defense to offense. We gauged how quickly they were able to identify issues, move toward fixing those issues and get back on track. Stimulus packages and a general recovery undoubtedly aided this effort, relieving part of the pressure.
As a result, private markets activity, including deal value, deal count, fundraising and exits, gained momentum over the last two quarters of the year as sponsors and investors maintained or increased activity. The “backlog” of activity was certainly real as both GPs acted to complete deals that were put on hold during the first half of the year and LPs sought to finalize allocations for 2020.
Private Equity
Fundraising Activity
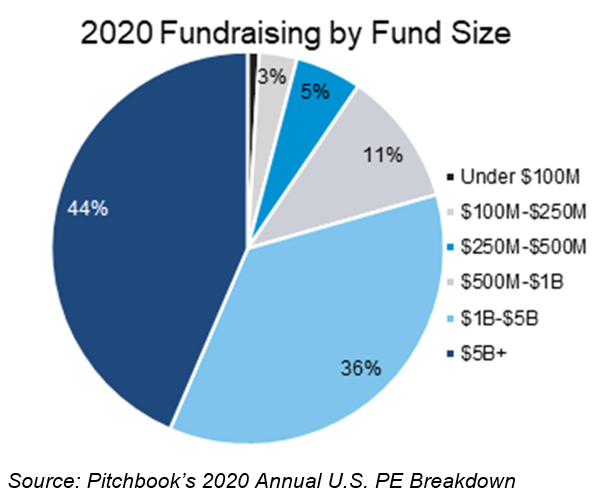
Fundraising activity hastened its pace notably in the second half of 2020 after a substantial stall in the second quarter. Total capital raised in U.S. Private Equity firms closed 231 funds accumulating $203 billion, marking a dollar decline of 37 percent. Although this was the lowest total in the past five years (2016-2020), it is still higher than the eight years prior (2008-2015). Mega funds, defined as those $5 billion and larger, accounted for 44 percent of all capital raised. This is a similar share to years past; however, there were fewer mega funds having their final close in 2020 (10 versus 14 in 2019). The only size segment to grow their share of fundraising dollars was funds in the $500 million to $1 billion range which increased by a slim margin.
The average time for private equity funds to be in market fundraising decreased by almost a month even though very few closes occurred in the second quarter of 2020. Over the past two years, time to close decreased by more than three months. This is a testament to the increasing amounts of competition within private markets, particularly with groups raising limited amounts of capital. Overall, on average, this was the least amount of time spent closing all PE funds since 2006.
First-time funds accounted for 11 percent of the fundraising amount ($6 billion) compared to 12 percent in 2019. While many LPs intentionally avoid first-time funds and newer firms, this particular group of early funds had a distinct advantage that may have lasting effects. These early funds do not have any (or at most, very few) portfolio companies to manage through the pandemic. So, while many GPs are spending more time with their portfolio companies than they would during pre-pandemic times, new GPs can spend a substantial amount of their time sourcing new opportunities.
Transaction Activity
Transaction activity told a very similar story as fundraising – a second half that was largely playing catch up to a muted first half. While closed and estimated deal activity for the full year fell approximately 30 percent, the second half was the strongest in more than a decade and accounted for roughly 60 percent of total deal value for the year. In what was a difficult year to grow companies organically, in-aggregate funds increasingly looked to build growth through add-on activity. Such transactions were robust during the year, accounting for approximately 72 percent of total buyout deal value, the highest percentage on record.
Despite fundraising from mega funds accounting for slightly less than half of total dollars raised, deals greater than $1 billion accounted for 1 percent of total transaction activity while deals less than $500 million in total transaction value accounted for 97 percent of activity. Even by dollar value, the largest deals only accounted for 27 percent of total value, suggesting that the largest funds continue to chase less opportunities relative to the smaller end of the market.
The healthcare and technology industries became front and center for transaction activity, in part because they were least impacted, or potentially most benefitted, by the environment. These two sectors accounted for 38 percent of overall deal value and 37 percent of overall deal count during 2020. Both percentage shares are about 400 basis points higher than 2019. Unsurprising given the environment, energy accounted for the fewest deals1.
1All data in the private equity section is from Pitchbook’s 2020 Annual U.S. PE Breakdown
The information contained herein is confidential and the dissemination or distribution to any other person without the prior approval of Fiducient Advisors is strictly prohibited. Information has been obtained from sources believed to be reliable, though not independently verified. Any forecasts are hypothetical and represent future expectations and not actual return volatilities and correlations will differ from forecasts. This report does not represent a specific investment recommendation. The opinions and analysis expressed herein are based on Fiducient Advisor research and professional experience and are expressed as of the date of this report. Please consult with your advisor, attorney and accountant, as appropriate, regarding specific advice. Past performance does not indicate future performance and there is risk of loss.