A look back on the target date landscape in 2022
Key Observations
- Target date offerings continued to garner the lion’s share of defined contribution assets and are now estimated to make up 50% of 401(k) plan assets.
- While the majority of cash flows into target date funds continues toward passive providers, a recent uptick in litigation targeting passive target date could have an impact.
- 2022 involved a number of target providers increasing their strategic equity glidepath, a trend that has been persistent for a decade.
- CIT vehicles have seen increased interest in a defined contribution menu and the target date space has not been immune to this.
What A Year!
As we look back on calendar year 2022, there are a myriad of topics that might be discussed in a market review for the year. While the focus for many investors and Plan Sponsors has been on the market sell-off, heightened volatility of equity and bond markets, rising and persistent inflation and the Fed’s relentless approach to raising interest rates, there have also been a flurry of updates across target date providers and landscape.
To quote a previous Fiducient Advisors’ research paper: Target Date Fund Selection – Actively Selecting a Passive Offering:
Since their initial introduction in 1994, target date funds have evolved from a rarely mentioned investment offering for defined contribution plan sponsors, to the cornerstone of most investment menus and the most widely used options among plan participants. The last decade has seen a particularly sharp increase in target date fund utilization due to their use as qualified default investment alternatives.
Since the time of that writing in 2017, the interest and utilization by Plan Sponsors and participants in target date solutions has exploded, and today these solutions make up approximately half of all assets within defined contribution plans. While balanced funds and managed accounts are the other eligible investments that qualify as QDIA eligible, approximately 86% of all plans use target dates as their QDIA.1 Target date funds continue to garner assets due to their ease of use for participants, their continued fee compression in recent years and their objective to provide a managed solution for participants that will allocate appropriately based on a participant’s age.
Target Date Utilization
There has been a meaningful increase in assets among target date solutions in recent years, a trend that persisted in 2022 despite the market down-turn. It is estimated that heading into 2022, target date assets were north of $3 trillion.2 While most major asset classes fell in 2022, it is estimated that target date fund assets remained above this $3 trillion figure due to strong participant contributions. Utilization of target dates by participants is high; higher than that of any other investment available to them within an employer-sponsored retirement plan, and one that has exponentially increased over the past decade. As shown in the chart below, contribution levels among participants are now surpassing 70% of their total contributions!
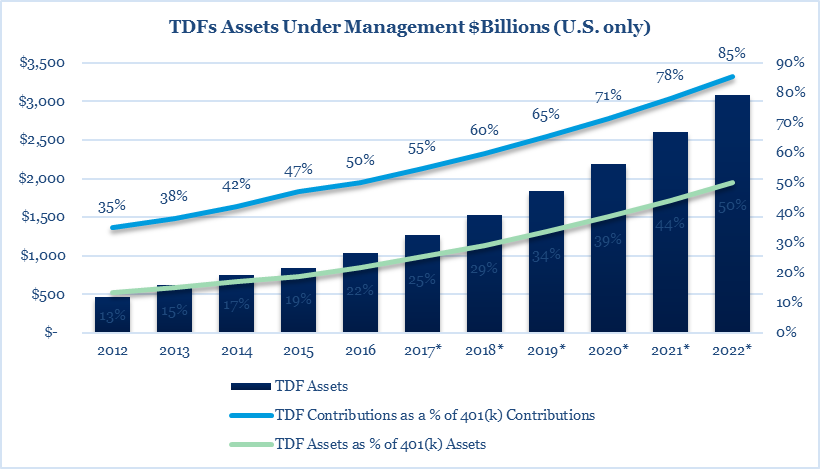
Source: RPAG Target Date
Data as of December 31, 2021
CIT Versus Mutual Fund
Unsurprisingly, with the increased assets and interest in target date funds, providers have focused on using this scale to drive down fees and remain competitively priced. While the institutional investment landscape has seen declining fees across solutions and asset classes in recent years, one related trend that has emerged is the prominence of Collective Investment Trusts (CITs) as a preferred vehicle for institutional investors. As shown in the following chart, CIT vehicles account for nearly half of target date assets according to Morningstar. While CIT structured vehicles are not new, interest has certainly increased, likely due to the potential for lower fees relative to mutual funds and improved transparency in recent years. While not a trend unique to only 2022, it is a trend that is likely to continue its rapid increase. Of note, CIT vehicles are not currently available to Plan Sponsors of 403(b) retirement plans typically offered by nonprofit organizations such as healthcare and higher education. However, despite this topic not being included within SECURE 2.0 Act’s passing, it is still widely believed to be only a matter of time before these plan types are provided access to this vehicle, which would open an entirely new market for these vehicles to grow.
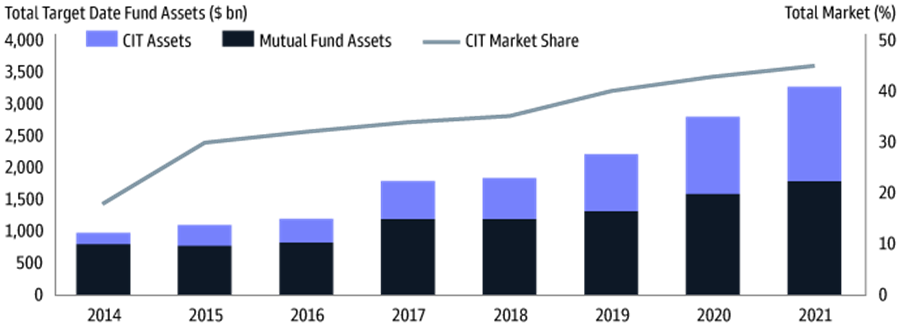
Source: Morningstar 2022 Annual Target Date Strategy Landscape. Data as of December 31, 2021.
Do Passive Target Date Funds Provide Greater Fiduciary Protection?
No. This is a question many Plan Sponsors, advisors and likely ERISA counsel have asked or fielded in recent years and the unanimous answer is (or should be) “no”. There is not a single target date, active nor passive, that is appropriate for all Plan Sponsors and their participants. While the Department of Labor (DOL) has provided guidance surrounding target date selection, there is no expectation that passive solutions or the cheapest solutions are the ones Plan Sponsors should select.
It is important for Plan Sponsors to understand that certain decisions made by a target date provider are in fact active in nature, even if the underlying building blocks of the solution are passive. The years 2018, 2019 and 2020 saw abundant litigation where target date funds were a topic of focus and in most instances the target date in question were an actively managed solution.3 This period might have led Plan Sponsors to believe that selecting a passively managed target date offering would make the plan a less likely candidate for a potential lawsuit. That changed in 2022, where litigation surrounding target date solutions continued, but many of the solutions in question were passive, as opposed to active. This development highlights the fact that passive target date solutions are not immune to litigation and scrutiny, and that Plan Sponsors should undertake a prudent process that thoroughly examines the characteristics and associated risk and return of a target date solution, be it active, passive or somewhere in between.
Higher Equity – Chasing Returns or Changing Environment?
Target date managers frequently conduct ongoing research initiatives and face changing long-term capital market assumptions, participant trends and new tools that can result in changes to the strategic allocations over time. While target date providers have always made changes as they perceive fit, 2021 and 2022 saw several providers make a common change to their offerings, increasing the strategic equity glidepath. The initial reaction might be that managers are chasing returns following a 10+year bull market among equities. However, the rationale is likely broader than that. While the drivers of these changes and the weights assigned to the drivers will differ by provider, many have cited lower long-term capital market expectations across asset classes and more attractive delta between equity and bond expectations for the long-term than previously believed. As shown below, over the past decade, the median equity glide path of target date providers has materially increased.
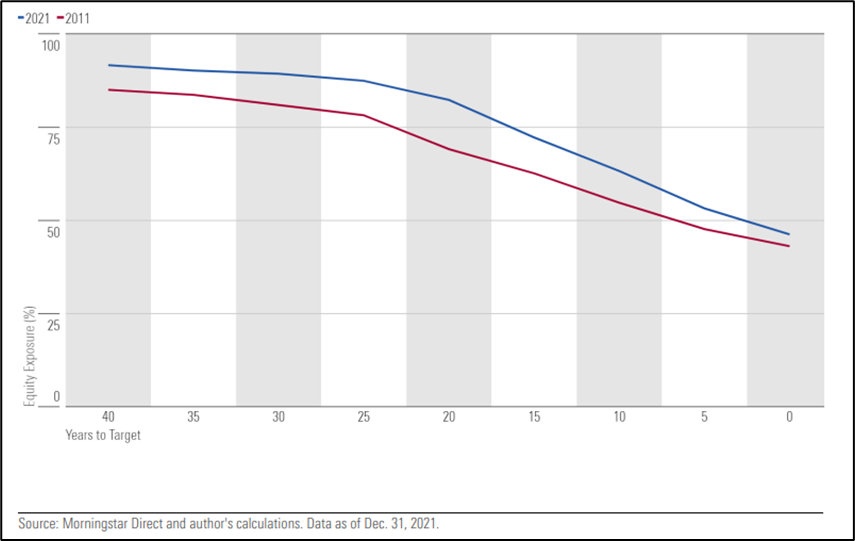
Source: Morningstar 2022 Annual Target Date Strategy Landscape
Another driver comes from the other side of the input formula for glide path construction: participant behavior. As target date providers gather more, better and faster participant data, their inputs for their glide path modeling will change. Some managers have noted common participant trends, one notable change stemmed from the 2020 volatility primarily driven by the COVID pandemic. Many managers were pleasantly surprised to learn that while participants overall had an uptick in account activity during the first half of 2020’s volatility, those participants invested in target date funds largely stayed invested. This outcome is something money managers, advisors and Plan Sponsors should all welcome, as abandoning investment strategy during volatility often has ill-effects on the participant’s ultimate account balance over their investing horizon. Regardless of the driver of the change, Plan Sponsors and participants should be cognizant of what they own, and it is likely that in recent years their target date provider has made a change in this broad direction.
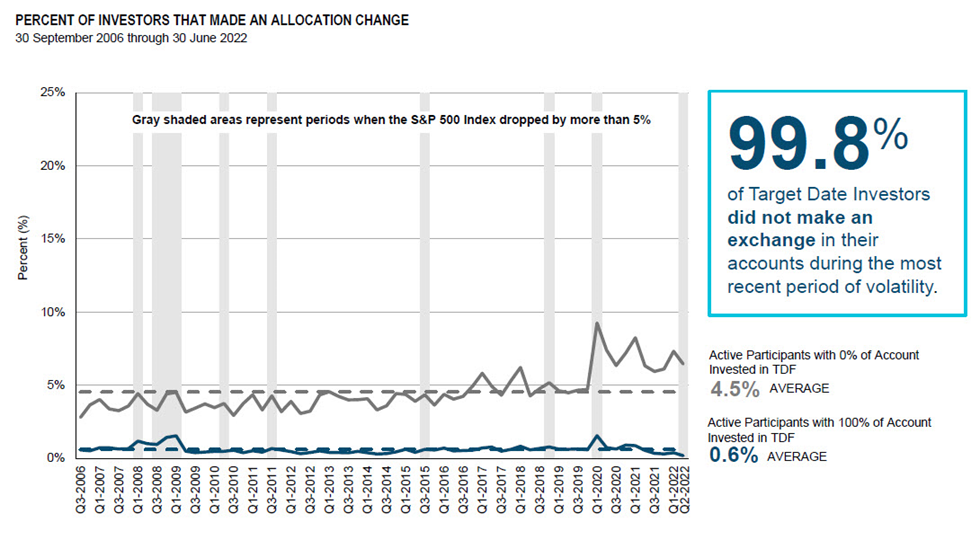
*Data based on plans for which T. Rowe Price Retirement Plan Services, Inc. provides recordkeeping services. Source: T. Rowe Price Retirement Plan Services, Inc. Data as of June 30, 2022.
In Closing
Target date products are largely considered the most complex investment vehicles in defined contribution plans. Whether it be from the multi-asset or multi-vintage structure, these solutions may always maintain a certain level of complexity relative to other investments typically held in a defined contribution core menu. Despite this, target date solutions have continued to garner the majority of cash flows in recent years and now make up the bulk of all defined contribution assets. 2022 represented a continuation in trends experienced in recent years, namely increased interest in CITs and a theme of increasing equity allocations amongst providers. 2022 also offered an important reminder that selecting a passively managed target date offering does not absolve the Plan Sponsor of any of its responsibilities when selecting a QDIA offering. While the aforementioned trends might surprise some, they are part of the evolving solution to better serve participants and they only reemphasize the importance of monitoring these solutions and having a prudent framework process and documentation structure in place.
For more information, please contact any of the professionals at Fiducient Advisors.
1 PSCA’s 64th Annual Survey, published 2022
2 Morningstar 2022 Annual Target Date Strategy Landscape, data as of March 23, 2022
3 https://www.natlawreview.com/article/target-date-fund-performance-litigation-advice-plan-fiduciaries. Data as of February 17, 2022.
The information contained herein is confidential and the dissemination or distribution to any other person without the prior approval of Fiducient Advisors is strictly prohibited. Information has been obtained from sources believed to be reliable, though not independently verified. Any forecasts are hypothetical and represent future expectations and not actual return volatilities and correlations will differ from forecasts. This report does not represent a specific investment recommendation. The opinions and analysis expressed herein are based on Fiducient Advisor research and professional experience and are expressed as of the date of this report. Please consult with your advisor, attorney and accountant, as appropriate, regarding specific advice. Past performance does not indicate future performance and there is risk of loss.