Every year, when tax time comes around I dutifully provide my accountant with the requested items needed to complete my tax returns. After a few nail-biting weeks, one of two things happens: I either get a notice to pay the IRS some seemingly illogical amount, or, if I am lucky, I receive the positive news that I will be receiving a refund. The arbitrary nature of tax season in my household may sound familiar to you if you are a Defined Benefit (DB) Plan Sponsor.
For many Defined Benefit Plan Sponsors, the uncertainty around the annual pension valuation and the calculation of the pension liabilities can sometimes feel like a mystery—that there is a special secret code to calculating liabilities for which only actuaries know. However, rest assured, the calculations themselves are quite straight forward. Unfortunately, however, the assumptions these calculations are based on is where art and science collide, which can make the simple and straightforward feel complex and overwhelming.
To help demystify pension liabilities, in this paper we break down the liability calculation to its simplest form to help you better understand how various assumptions impact its outcome.
Understanding the Purpose of Pension Liabilities
At its core, a pension plan is designed to deliver retirement income security to its participants. The plan accumulates contributions from the employer on behalf of its workforce, invests those contributions for future growth and then uses both the original contributions and the investment returns to pay out the promised benefits down the road. When a pension plan is functioning as it should, the assets held by the plan are intended to match the value of the benefits it has promised to pay.
This is in stark contrast to programs like Social Security, which operate on a pay-as-you-go model. Today’s workers directly fund today’s retirees, with no pooled investment of assets for the future. Pension funds, on the other hand, are meant to accumulate assets over time, invest them wisely, and ensure they grow enough to cover retirement benefits that will be paid in the years to come.
Breaking Down Pension Liability
First, let’s define the liability. The pension liability represents the value of the retirement benefits that a plan sponsor has promised to pay participants. It’s simply today’s values, or the “present value,” of all the future benefit payments projected to be paid by the plan to participants in retirement over the life of the plan.
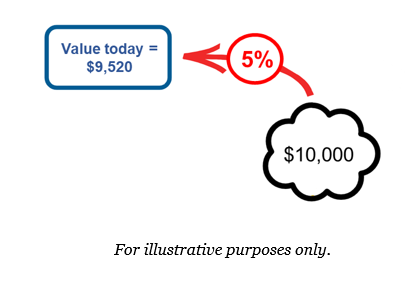
Let us start with a basic example: the present value of one single payment of $10,000 that will be received one year from today. The $10,000 received in one year must be “discounted” to today to adjust for the fact that money received today can be invested, earning a rate of interest in the meantime. In our example, assume the money today could earn 5% over the next year. Therefore, the value of $10,000 received one year from now is about $9,520 today.
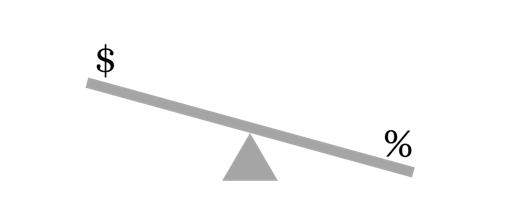
Now, instead let’s assume the interest rate is lower than 5%, say 2.5%. In this case, the present value of $10,000 received one year from today increases. Since your investment return is assumed to be lower than in the first example, you need more dollars today to grow to the same $10,000 in one year from now. At a 2.5% interest rate, the present value of $10,000 payable in one year is approximately $9,750, an increase of over $230. Notice this important relationship, as interest rates decrease, the present value/liability increases and vice versa.
Next, let us extrapolate this simple present value calculation into a lifetime of benefit payments, not just one payment received next year. Each participant in a pension plan is expected to receive his or her benefits for a number of years based largely on the specific plan provisions and mortality expectations.
The present value of all these future benefit payments for this one participant represents the pension liability for this individual.
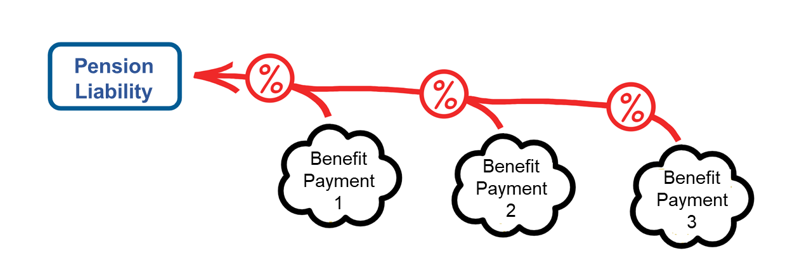
To calculate the total pension liabilities, the future annual benefit payments for every participant for every year of the plan’s lifetime must be aggregated. These aggregated future benefit payments are then discounted today following the same method as the present value approach outlined above for one individual. The present value of all these aggregate future benefit payments results in the total liability of the pension plan today.
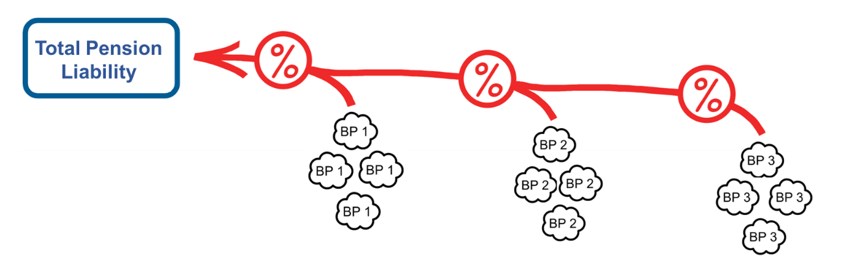
Armed with the schedule of the plan’s aggregate future benefit payments, the impact of a changing interest rate environment can be easily assessed and analyzed.
Understanding Unfunded Liabilities in Pension Plans
Now that we’ve broken down how pension liabilities are calculated, let’s clarify a common point of confusion: unfunded liabilities
At its core, an unfunded liability arises when the total value of future benefit payments promised to participants exceeds the assets currently set aside in the pension fund. Think of it as a gap between what has been promised and what’s actually available – a shortfall that needs to be addressed so everyone receives the benefits they’ve earned.
When a pension plan is running smoothly, it collects contributions from employers (and sometimes from employees as well), invests those funds and ideally grows the assets to match or exceed the projected value of promised benefits. The goal is for assets to be sufficient to cover all future payments, accounting for both investment growth and ongoing contributions.
However, if the value of the plan’s assets dips below the present value of the projected benefit payments, the gap that emerges is referred to as an “unfunded liability.” This shortfall can arise for a variety of reasons, including:
• Investment returns not meeting expectations
• Changes in demographic assumptions, such as participants living longer than anticipated
• Insufficient contributions over time
• Adjustments to benefit formulas or plan provisions that increase future obligations
Here’s a simple way to think about it:
• The liability represents the plan’s promise: the accumulation of all the benefits scheduled to be paid out, calculated in today’s dollars using the present value approach we discussed earlier.
• Unfunded liability happens if the assets (the pool of money accumulated from contributions plus investment returns) fall short of covering these promises.
Unfunded liabilities aren’t unusual, and they can occur for several reasons: investment performance, changes in assumptions (like life expectancy or salary growth) or periods where contributions don’t keep pace with the growing obligations.
We believe that understanding where these gaps come from is key to managing and securing the long-term health of a pension plan.
An Example of Unfunded Liabilities in Action*
To illustrate how unfunded liabilities can develop in a pension plan, imagine this scenario: suppose the plan’s actuaries determine that, over the coming decades, the plan is committed to paying out a total of $1 billion in benefits to all current and future retirees. However, when the dust settles and the value of the plan’s assets is tallied up, only $900 million sits in the coffers. This $100 million gap between what the plan has on hand and what it needs to meet its promised obligations is called the unfunded liability.
Think of it as similar to planning a cross-country road trip from Seattle to Miami. If your calculations show you’ll need $1,000 for fuel, but you only have $900 set aside, you’re $100 short of what’s required to comfortably make the journey. In the pension world, this shortfall means the plan sponsor will either need to find ways to bridge the gap through increased contributions, enhanced investment returns or changes to benefits or risk not fully delivering on the promised income to retirees.
*For illustrative purposes only.
Who Pays for Unfunded Pension Liabilities?
When a pension plan finds itself with unfunded liabilities, that is, when the assets on hand are not sufficient to cover the future benefits promised to participants the responsibility for bridging this gap falls squarely on the shoulders of the plan sponsors. In the context of most public pension plans, this typically means the relevant state or local government employer which may lead to increased taxes to its citizens
These employers are obligated to make additional contributions over time, often referred to as “amortization payments,” to gradually eliminate the shortfall. If you think of a mortgage, where regular payments are made to pay down a loan, the same principle applies here: employers pay down the pension’s unfunded liability through structured, scheduled contributions until the gap is closed.
Ultimately, funding public pensions is a legal and financial obligation of the governmental entity sponsoring the plan. Should these employers fail to contribute the required amounts, the unfunded liability persists, and that can lead to further fiscal challenges, pressure on budgets, or, in some cases, modifications to benefits or funding policies down the line. So, while actuarial science and regulatory assumptions shape how these liabilities are measured, it is the employers themselves, supported by taxpayer, who are responsible for ensuring the pension promises to remain on solid financial footing.
The Collision of Art and Science
Now that you have a better understanding of pension liabilities, your next question may be “So how are the future benefit payments calculated?”. This is where actuarial art and science collide.
For retirees, the future benefit payments are relatively straight forward. Since these participants are already receiving their benefits, the primary unknown is how long each retiree’s benefit will continue. That determination depends on the form of benefit elected (e.g., single life, joint and survivor, etc.) and the retiree’s life expectancy, as estimated using actuarial mortality models.
For participants who have not yet begun receiving their benefits, there are many more unknowns related to their future benefit payments. Not only do we not know how long each participant’s benefit payments will continue once they commence their benefits, we also do not know when they will decide to start collecting their benefit and which payment form they will elect once in retirement. For plans that are not frozen, the amount of future benefit accruals represent another unknown piece of the puzzle.
To estimate future benefit payments from the plan, the actuary must make assumptions regarding all of these unknowns. Many of the unknowns require the actuary to use their expertise to select appropriate assumptions; however, other assumptions are prescribed by regulatory and accounting bodies that oversee defined benefit plans (i.e., IRS, PBGC, FASB, IFRS).
Unfortunately for Plan Sponsors, these regulatory bodies have not established consistency across their prescribed assumptions. As a result, the same pension plan could potentially generate multiple projected benefit payment streams, each based on a different set of required assumptions. These differences give rise to multiple liability measures, each serving a distinct regulatory, accounting, or funding purpose.
While each liability measure is meaningful within its intended context, the existence of multiple measures can understandably create confusion for plan sponsors.
When thinking about which liability measure a Plan Sponsor should focus on, the short answer is that it depends. For the purpose of evaluating Liability Driven Investment strategies, we suggest looking at the measure that most closely reflects the economic value of the pension plan which tends to align closest to the Financial Accounting Standards Board’s (FASB) standards.
For more help demystifying your pension plan or with constructing or evaluating the plan’s investment strategy, please reach out to any of the professionals on the Fiducient Advisors defined benefit team.
The information contained herein is confidential and the dissemination or distribution to any other person without the prior approval of Fiducient Advisors is strictly prohibited. Information has been obtained from sources believed to be reliable, though not independently verified. Any forecasts are hypothetical and represent future expectations and not actual return volatilities and correlations will differ from forecasts. This report does not represent a specific investment recommendation. The opinions and analysis expressed herein are based on Fiducient Advisor research and professional experience and are expressed as of the date of this report. Please consult with your advisor, attorney and accountant, as appropriate, regarding specific advice. Past performance does not indicate future performance and there is risk of loss.