Considerations for Plan Sponsors
Key Observations
- Federal Reserve policy and market reaction have driven interest rates and corporate pension discount rates significantly higher since the beginning of 2020.
- The overall effect for an average plan has been an increase in funded status due to higher discount rates and lower projected liabilities.
- As interest rates change dramatically and quickly, liability and fixed income interest rate sensitivity or duration does as well.
- Plan Sponsors who are not actively monitoring the duration profile of their assets and liabilities may see an increasingly large mismatch in those duration profiles.
- This mismatch could result in an unintended deviation from their stated investment strategy and potential non-compliance with their investment policy statements.
Read further to learn how rising discount rates could affect your liability hedging strategy.
2022: Significantly Higher Pension Discount Rates, Lower Projected Liabilities
Interest rates have risen significantly over the course of 2022, between 1.4 percent and 3.1 percent across the U.S. Treasury Yield Curve:
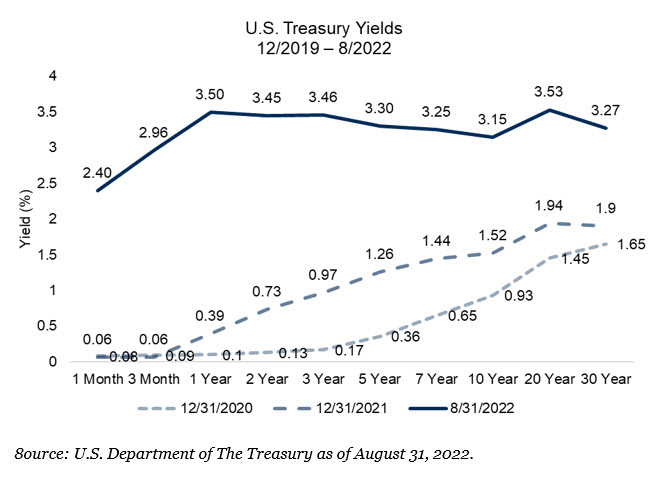
Higher U.S. Treasury yields and wider credit spreads have comensurately led to higher pension discount rates and lower projected pension liabilities. Though nearly all asset classes are broadly negative in 2022, the decline in projected pension liabilities has generally outpaced the decline in return-seeking assets, leading many plans to see gains in their funded statuses this year despite negative asset returns.
Changes in Liability Duration
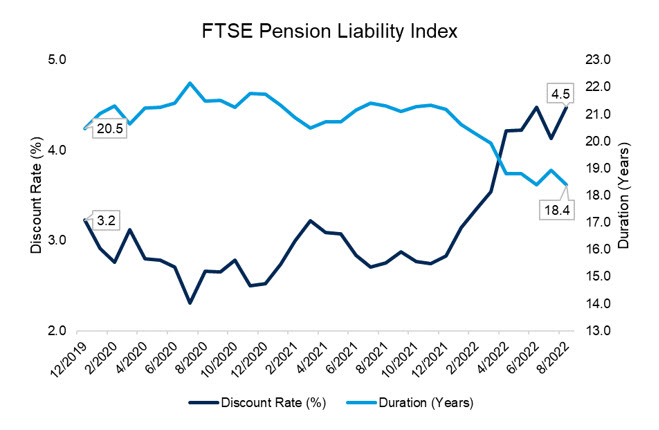
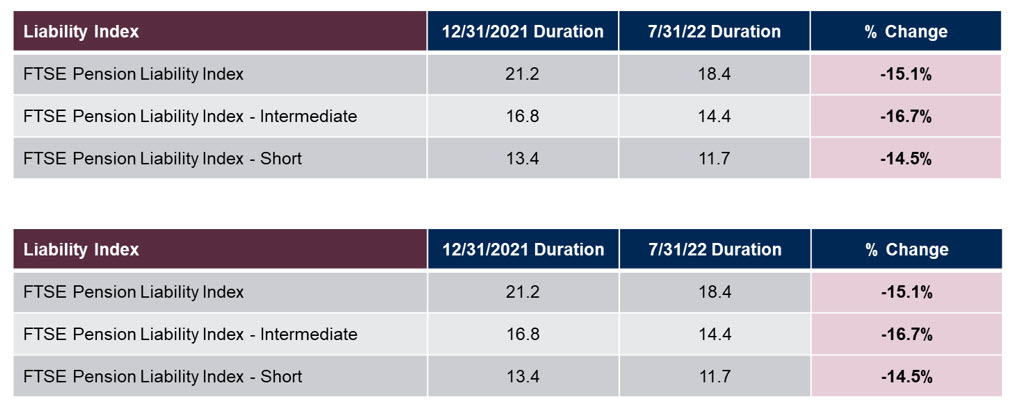
While funded status gains in 2022 have been a positive outcome for many plans, it is important for Plan Sponsors to understand that higher interest rates have also lead to a decline in pension liability interest rate sensitivity, or duration. As pension discount rates have increased more than 30 percent this year, liability durations have come down anywhere from 14 percent to 17 percent depending on the duration of liabilities at the start of 2022.1
For Plan Sponsors who are utilizing hedging assets to reduce funded status volatility without using custom liability-driven investing portfolios tailored to their specific liability stream, this sharp decrease in liability duration might lead to a duration mismatch between hedging assets and liabilities as well as a likely increase in funded status volatility if not monitored closely.
For example, the FTSE pension liability index (a series of discount rates used to discount pension liabilities) has seen its duration fall from 21.2 years to 18.4 years as of August 31, 20222. For a pension plan with a $500 million liability, this 2.8-year decrease in liability duration equates to a decrease in liability volatility of approximately $12 million2. If the hedging assets are not adjusted for the reduction in the liability volatility, this may lead to an unintended increase in overall funded status volatility. To be both more specific and timely, it would likely leave the pension plan over-hedged in an environment of potentially higher interest rates should inflation continue to remain elevated. Unintentionally over-hedging a liability in a rising interest rate environment would likely generate an adverse effect on funded status.
Duration Mismatch Between Assets and Liabilities
As mentioned earlier, plans with custom LDI mandates or those utilizing a discretionary investment consultant have a specific party dedicated to overseeing the liability-hedging assets of a pension plan. For other Plan Sponsors who are less timely and precise in their liability-hedging, there is greater potential of a duration mismatch. One reason is that fixed income funds will not (and have not) seen the same magnitude of change in duration that liabilities and liability discount rates have. As outlined on the following page, liability discount rates have fallen more in 2022 than the majority of common liability-hedging fixed income benchmarks as well as certain widely used fixed income mutual funds.
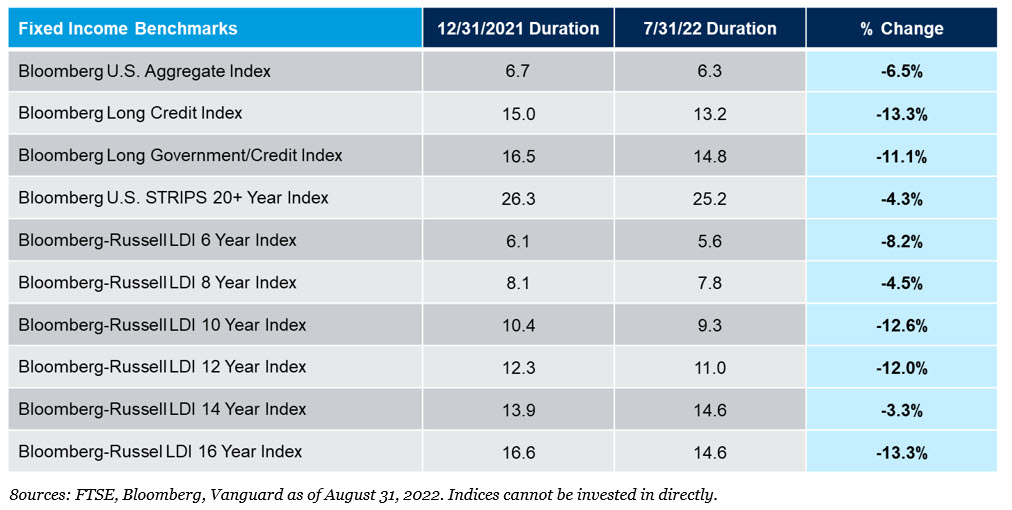
For example, a Plan Sponsor using a single bond fund benchmarked to the Bloomberg Long Credit or Long/Government Credit Index has seen the duration of their fixed income portfolio decrease between 11.1 and 13.3 percent this year while their liability, as measured by the FTSE Pension Liability Index, may have dropped anywhere between 15.5 percent and 16.7 percent.
For Plan Sponsors leveraging higher duration asset classes, such as U.S. Treasury STRIPS to increase the plan’s hedge ratio, that strategy has not only hurt from a performance perspective but has likely led to an overhedged portfolio if not overseen and readjusted properly. The Bloomberg U.S. STRIPS 20+ Year Index is down 30.8 percent through August 31, 2022, while global stocks are down 17.8 percent and the Bloomberg Long Government/Credit Index is down 24.6 percent over that same period3. The FTSE Pension Liability index has declined 26 percent through August 31, 2022. On the duration front, the Bloomberg U.S. STRIPS 20+ Year Index has seen its duration fall by only 4.3 percent in 2022 through August 31, 2022, compared to the FTSE Pension Liability Index, which fell between 14.5 percent and 16.7 percent, depending on starting duration in 2022.
A proper liability-hedging strategy requires diligence and oversight, especially in times of market volatility. For Plan Sponsors not employing a custom LDI strategy, this level of oversight is essential to prevent unintentional portfolio positioning, which could lead to unintended and adverse liability-relative performance.
For more information, please contact any of the professionals at Fiducient Advisors.
1FTSE as of August 31, 2022
2FTSE as of August 31, 2022
3Bloomberg as of 8/31/2022
Comparisons to any indices referenced herein are for illustrative purposes only and are not meant to imply that actual returns or volatility will be similar to the indices. Indices cannot be invested in directly. Unmanaged index returns assume reinvestment of any and all distributions and do not reflect our fees or expenses.
FTSE Pension Liability Index represents the single discount rate that would produce the same present value as calculated by discounting a standardized set of liabilities using the FTSE Pension Discount Curve. The FTSE Pension Discount Curve is a set of yields on hypothetical AA zero coupon bonds whose maturities range from 6 months up to 30 years. The yields of the FTSE Pension Discount Curve are used to discount pension liabilities. The FTSE Pension Discount Curve is calculated based on a universe of AA rated corporate bonds from the FTSE US Broad Investment Grade Bond Index (USBIG®) and the yields of FTSE Russell’s Treasury model curve. Along with the rate, monthly returns and durations for the FTSE Pension Liability Index liabilities are also made available. The Standard FTSE Pension Liability Index: with a weighted average life (WAL) of 26.9 years, the index represents a fully-open plan.
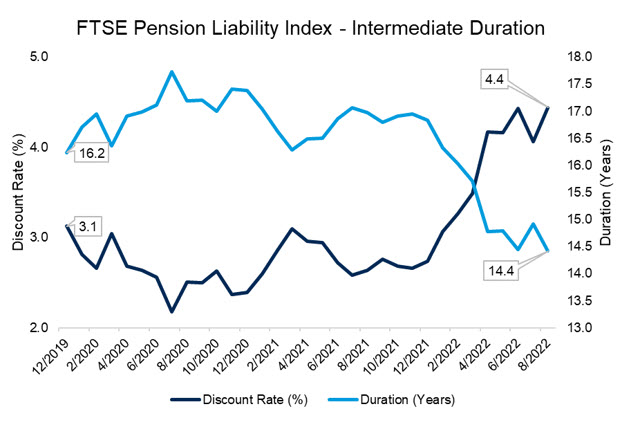
FTSE Pension Liability Index– Intermediate represents the single discount rate that would produce the same present value as calculated by discounting a standardized set of liabilities using the FTSE Pension Discount Curve. The FTSE Pension Discount Curve is a set of yields on hypothetical AA zero coupon bonds whose maturities range from 6 months up to 30 years. The yields of the FTSE Pension Discount Curve are used to discount pension liabilities. The FTSE Pension Discount Curve is calculated based on a universe of AA rated corporate bonds from the FTSE US Broad Investment Grade Bond Index (USBIG®) and the yields of FTSE Russell’s Treasury model curve. Along with the rate, monthly returns and durations for the FTSE Pension Liability Index liabilities are also made available. The Intermediate FTSE Pension Liability Index: with a weighted average life (WAL) of 21.2 years, the index represents a plan that is closed to new entrants
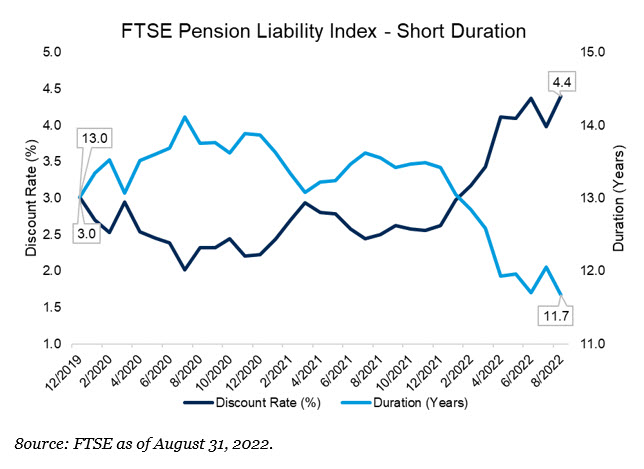
FTSE Pension Liability Index-Short represents the single discount rate that would produce the same present value as calculated by discounting a standardized set of liabilities using the FTSE Pension Discount Curve. The FTSE Pension Discount Curve is a set of yields on hypothetical AA zero coupon bonds whose maturities range from 6 months up to 30 years. The yields of the FTSE Pension Discount Curve are used to discount pension liabilities. The FTSE Pension Discount Curve is calculated based on a universe of AA rated corporate bonds from the FTSE US Broad Investment Grade Bond Index (USBIG®) and the yields of FTSE Russell’s Treasury model curve. Along with the rate, monthly returns and durations for the FTSE Pension Liability Index liabilities are also made available. The Short FTSE Pension Liability Index: with a weighted average life (WAL) of 16.8 years, the index represents a fully-closed plan
Bloomberg U.S. Aggregate Index covers the U.S. investment grade fixed rate bond market, with index components for government and corporate securities, mortgage pass-through securities, and asset-backed securities.
Bloomberg Long Credit Index is the long component of the U.S. Credit index, which includes securities in the Credit Index. The credit index includes publicly issued U.S. corporate and foreign debentures and secured notes that meet specified maturity, liquidity, and quality requirements.
Bloomberg Intermediate U.S. Gov’t/Credit is the Intermediate component of the U.S. Government/Credit index, which includes securities in the Government and Credit Indices. The Government Index includes treasuries and agencies, while the credit index includes publicly issued U.S. corporate and foreign debentures and secured notes that meet specified maturity, liquidity, and quality requirements.
Bloomberg U.S. STRIPS 20+ Year Index covers the U.S. Treasury STRIP bond market, for Treasury STRIPs with maturities equal to or greater than 20 years.
Bloomberg-Russell LDI 6 Year Index is a cash bond benchmark for LDI portfolios designed to track a duration target of 6 years. The index is composed of non-callable securities that meet the eligibility requirements of the Barclays U.S. Credit Index and have a credit quality of at least Q3/A-/A- based on the minimum rating of Moody’s, Fitch, and S&P. The minimum maturity is set to align the index duration with the target and is adjusted on an annual basis if the drift falls outside a set boundary
Bloomberg-Russell LDI 8 Year Index is a cash bond benchmark for LDI portfolios designed to track a duration target of 8 years. The index is composed of non-callable securities that meet the eligibility requirements of the Barclays U.S. Credit Index and have a credit quality of at least Q3/A-/A- based on the minimum rating of Moody’s, Fitch, and S&P. The minimum maturity is set to align the index duration with the target and is adjusted on an annual basis if the drift falls outside a set boundary
Bloomberg-Russell LDI 10 Year Index is a cash bond benchmark for LDI portfolios designed to track a duration target of 10 years. The index is composed of non-callable securities that meet the eligibility requirements of the Barclays U.S. Credit Index and have a credit quality of at least Q3/A-/A- based on the minimum rating of Moody’s, Fitch, and S&P. The minimum maturity is set to align the index duration with the target and is adjusted on an annual basis if the drift falls outside a set boundary
Bloomberg-Russell LDI 12 Year Index is a cash bond benchmark for LDI portfolios designed to track a duration target of 12 years. The index is composed of non-callable securities that meet the eligibility requirements of the Barclays U.S. Credit Index and have a credit quality of at least Q3/A-/A- based on the minimum rating of Moody’s, Fitch, and S&P. The minimum maturity is set to align the index duration with the target and is adjusted on an annual basis if the drift falls outside a set boundary
Bloomberg-Russell LDI 14 Year Index is a cash bond benchmark for LDI portfolios designed to track a duration target of 14 years. The index is composed of non-callable securities that meet the eligibility requirements of the Barclays U.S. Credit Index and have a credit quality of at least Q3/A-/A- based on the minimum rating of Moody’s, Fitch, and S&P. The minimum maturity is set to align the index duration with the target and is adjusted on an annual basis if the drift falls outside a set boundary
Bloomberg-Russell LDI 16 Year Index is a cash bond benchmark for LDI portfolios designed to track a duration target of 16 years. The index is composed of non-callable securities that meet the eligibility requirements of the Barclays U.S. Credit Index and have a credit quality of at least Q3/A-/A- based on the minimum rating of Moody’s, Fitch, and S&P. The minimum maturity is set to align the index duration with the target and is adjusted on an annual basis if the drift falls outside a set boundary.
The information contained herein is confidential and the dissemination or distribution to any other person without the prior approval of Fiducient Advisors is strictly prohibited. Information has been obtained from sources believed to be reliable, though not independently verified. Any forecasts are hypothetical and represent future expectations and not actual return volatilities and correlations will differ from forecasts. This report does not represent a specific investment recommendation. The opinions and analysis expressed herein are based on Fiducient Advisor research and professional experience and are expressed as of the date of this report. Please consult with your advisor, attorney and accountant, as appropriate, regarding specific advice. Past performance does not indicate future performance and there is risk of loss.