Restoration of Higher Bond Yields Will Be Welcome Relief for Public Plans
Public Defined Benefit (DB) and Other Post Employee Benefit (OPEB) plans typically measure their financial progress on a fiscal year (FY) that ends June 30. After a strong FY in 2021 produced outsized investment returns that resulted in improved funded statuses for most public pension plans, FY 2022 proved the opposite. Aggressive interest rate hikes by the Federal Reserve to combat stubbornly high inflation, waning stimulus and fears of an economic slowdown all have weighed heavily on global markets in 2022 as most major asset classes have sold off in dramatic fashion.
Using the MSCI ACWI and the Bloomberg Aggregate indices as a proxy for investment performance, the return differential for a 60/40 portfolio (60 percent global equities/40 percent domestic fixed income) over the last two fiscal years ending June 30 is rather significant:
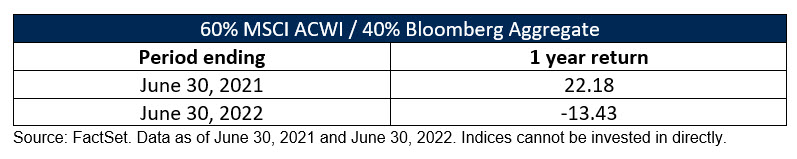
As a result of sharply lower investment returns for FY 2022, U.S. state and municipal retirement systems will likely see their aggregate funding ratio make their biggest decline since the global financial crisis in 2009, according to a report from Equable Institute, a bipartisan nonprofit that provides data and analysis about public pension funds.1 However, public pension-funded ratios may have looked even worse this fiscal year had pension systems not lowered their investment return assumptions in previous years, failing to make adequate contributions.
Fortunately, many pension systems were disciplined regarding investment assumptions and contributions.2 According to the report, 99.8 percent of required contributions were made by state and municipal governments in 2021.3 Continuing the contribution trend, public plans have also made one-time supplemental contributions using supplemental funds, rainy day funds and budget surpluses to make one-time contributions into their pension funds to shore up their funding levels and buy down their assumed rates of return. Yet, despite these positive developments, the Institute said in its State of Pensions 2022 Report that the aggregate funding ratio for U.S. public pension funds will likely fall to 77.9 percent as of June 30, 2022, down from 84.8 percent during the prior year.4 That is a sharp decline year-over-year; however, from a historical context, it pales in comparison to the pain public plans experienced during the Global Financial Crisis (GFC) more than a decade ago. By June 30, 2009 the funded ratio for U.S. public plans had fallen to 62.4 percent from 92.3 percent just two years earlier.5
Jennifer Castelhano, Principal and Consulting Actuary at Milliman, confirmed just as much, saying the investment losses in FY 2022 will likely offset most of the investment gains from FY 2021. “This is why we utilize asset smoothing mechanisms for purposes of plan funding,” Castelhano explained. “For plans that use asset smoothing, the impact on the funded ratio and Actuarially Determined Contribution will be minimized,” she elaborated, “but for the purposes of GASB 68 and GASB 75, a plan’s funded ratio is required to be calculated based on the market value of assets. This will likely result in a decrease in the funded ratio reported in the Plan Sponsor’s Annual Comprehensive Financial Report for FY22.”6
Restoration of Yield Will Help Pension Plans
Long-term U.S. government bond yields trended down for the past 40 years likely producing one of the longest bond bull markets on record. The yield on a bond moves inverse to its price, so as bond yields trended lower over the years bond prices increased. Falling bond yields were driven by the macroeconomy, specifically reductions in long-run expectations of inflation and accommodative central bank policies around the globe. As nominal yields plunged and real yields turned negative, the income and return stream fixed income allocations had historically produced quickly diminished. To shore up funding shortfalls and earn the plan’s assumed investment rate of return, many pension plans shifted assets away from fixed income to global public equities and alternative investments such as hedge funds or private equity. Public plans, in search of higher yield, were likely willing to take on additional credit risk within their fixed income portfolio.
While 2022 is shaping up to be one of the worst years on record for bonds, the silver lining around the rapid increase in interest rates (and the other side of the fixed income bear market coin) is the restoration of a better yield structure with the potential to benefit public pension portfolios in the long run.
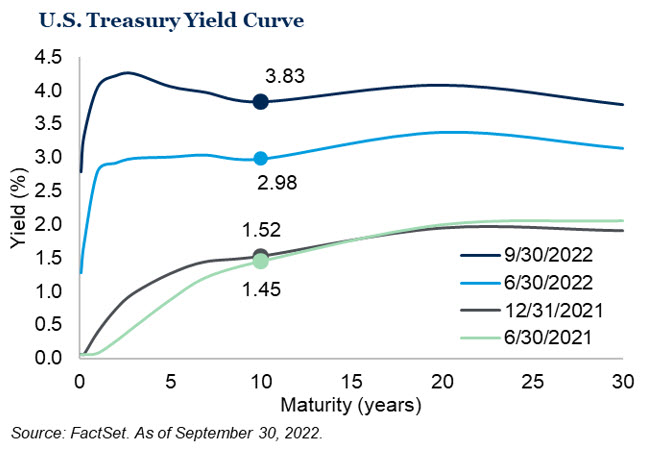
As the chart below illustrates, yields increased significantly since the end of the fiscal year on June 30, 2021. At that time, the yield on the 10-year U.S Treasury was 1.45 percent. Fast forward to the most recent fiscal year ending June 30, 2002, the yield on the 10-year stood at 2.98 percent and increased to 3.83 percent at the end of September 30, 2022, levels we haven’t seen in more than a decade.7
The spike in yields wasn’t limited to the U.S. Treasuries. The yield on the bellwether Bloomberg U.S. Aggregate Bond Index, a proxy for the U.S. bond market, jumped from 1.8 percent at the start of the year to 4.8 percent at the end of September while the yield on the Bloomberg U.S. High Yield Corporate Bond Index rose from 2 percent at the start of the year to 9.7 percent at the end of September.8
We believe the bond market today offers better value, and the spike in yields may present an attractive opportunity to bring the fixed income portion of portfolios back into balance. For public pension plans with a long-term portfolio context, bonds provide income, and they can have inherently less volatility than equities.
Public pension plans rely on fixed income to provide that ballast within a portfolio setting and the Fed’s commitment to combating inflation through a series of aggressive interest rate hikes will likely benefit public pension plans in the long-term. How so? The restoration of higher yields may provide higher incremental income and will likely add incremental value in meeting the pension plan’s investment return objective.
The prospect of a better yield profile for fixed income investments may entice Plan Sponsors to reduce exposure to riskier segments of the capital markets and ensure that their asset allocation properly aligns with their long-term investment return assumption and risk tolerance. While the rise in yields may portend volatility in the months ahead, Plan Sponsors should re-examine the construct of their fixed income allocation with respect to duration and credit quality as well as allocation across passive and active mandates, spanning both domestic and international investments. This volatility creates potential opportunities across sectors that may generate an attractive yield without going down the credit spectrum.
Forward-looking Return Expectations Improve
While markets during the first half of 2022 have been challenging, it is important to remember that they move based on changing expectations about the future. While painful in the short-term, the selloff has repriced many assets across fixed income and equity classes to more compelling valuations on a forward-looking basis. Although it is foolhardy to predict market bottoms, it is important to note they have usually come with peaks in both pain and pessimism. It is unlikely to be different during this bear market.
Our capital markets research team regularly surveys the investing landscape. When we see meaningful changes, we revise our forward-looking assumptions. We completed this exercise in early June for the period ending May 31. Our forward-looking 20-year return expectations for fixed income and global equites, as an example, increased due to this year’s wide scale repricing of markets.
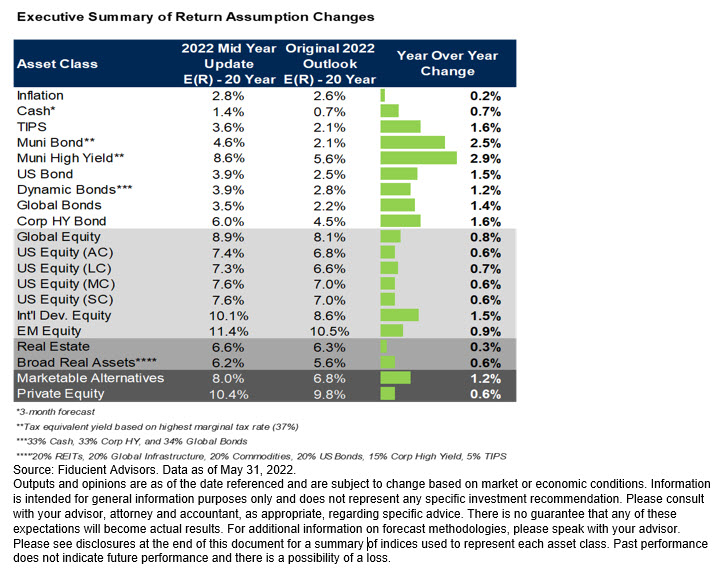
Higher forward-looking return expectations across the global markets are expected to drive higher return profiles across most asset allocation settings. An effective asset allocation is vital for any long-term investment strategy and involves spreading an investment portfolio over a range of asset classes to improve returns and reduce risk.
As market conditions evolve, it is important for stewards of public pension and OPEB portfolios to review their existing asset allocation to reaffirm it aligns with the plan’s investment return assumption and tolerance for downside risk. As we have observed over the last few years, many public plans lowered the return assumptions that inform their investment decisions as interest rates had trended down for more than two decades while equity valuations had increased. Lowering the investment return assumption to more achievable targets also can decrease the likelihood of accruing unfunded liabilities in the future.
Despite the trend of lower investment return assumptions, pension funds continued to reallocate away from low-yielding fixed-income investments to equities and alternatives to achieve their return targets. Today’s higher interest rate environment, combined with lower pension investment return assumptions, could result in a reversion back to higher fixed income allocations for public plans. Other plans may opt to maintain their existing asset allocation to shore up funding shortfalls.
Castelhano from Milliman notes that, “While it is welcome news that the market outlook has improved and resulted in higher expected investment returns, Plan Sponsors should be cautious not to overreact to current market conditions when it comes to setting the discount rate assumption.” She reiterates that “Plan Sponsors have been working diligently to lower the discount rate for over a decade and should continue to remain patient with respect to this assumption.” Castelhano believes this is an opportune time for Plan Sponsors to press pause on the discount rate assumption and consider reevaluating it with the next valuation cycle.9
In this environment, plan administrators, fiduciaries and policymakers who select and oversee investment strategies must understand the effect of market volatility on plan assets and government budgets. Employing a governance process that examines and codifies an effective asset allocation policy and discount rate assumption is a step in the right direction.
For additional information, please contact any of the professionals at Fiducient Advisors.
1Pension & Investments July 2022 U.S. Public Pension Plans’ Funding Ratio Likely to Plummet For Fiscal Year
2Pension & Investments July 2022 U.S. Public Pension Plans’ Funding Ratio Likely to Plummet For Fiscal Year
3Equitable Institute State of Pensions October 2022 Report, Equable.org
4The report measured trends in the 228 state and municipal pension funds that have at least $1 billion in accrued liabilities.
5An Empirical Analysis of State and Local Public Pension Plan Funded Ratio Change, 2001-2009. Quishi Wang and Jun Peng, September 2016.
6Interview with Jennifer Castelhano, Principal and Consulting Actuary at Milliman, October 10, 2022
7FactSet. Data as of September 2022
8Bloomberg.org. Data as of September 2022
9Interview with Jennifer Castelhano, Principal and Consulting Actuary at Milliman, October 10, 2022
Bloomberg Aggregate Bond Index covers the U.S. investment grade fixed rate bond market, with index components for government and corporate securities, mortgage pass-through securities, and asset-backed securities.
MSCI ACWI is a stock index designed to track broad global equity-market performance. Maintained by Morgan Stanley Capital International (MSCI), the index is comprised of the stocks of about 3,000 companies from 23 developed countries and 26 emerging markets.
Bloomberg U.S. High Yield Corporate Bond Index is a rules-based, market-value-weighted index engineered to measure publicly issued non-investment grade USD fixed-rate, taxable and corporate bonds. To be included in the index, a security must have a minimum par amount of $250 million and have a minimum maturity of 1 year at rebalancing. Emerging market debt is excluded.
When referencing asset class returns or statistics, the following indices are used to represent those asset classes, unless otherwise noted. Each index is unmanaged, and investors can not actually invest directly into an index:
TIPS: Bloomberg Global Inflation-Linked: U.S. TIPS Total Return Index Unhedged
Municipals 5-Year: Bloomberg Municipal Bond 5 Year (4-6) Total Return Index Unhedged USD
Core Bond: Bloomberg US Aggregate Total Return Index USD
High Yield Municipals: Bloomberg Muni High Yield Total Return Index Value Unhedged USD
High Yield: Bloomberg US Corporate High Yield Total Return Index USD
U.S. Long Duration: Bloomberg US Aggregate Government & Credit – Long
Foreign Bond: Bloomberg Global Aggregate ex-USD Total Return Index Value USD (50/50 blend of hedged and unhedged)
Real Assets: S&P Real Assets
U.S. Large Cap: Russell 1000 Total Return Index
U.S. Small Cap: Russell 2000 Total Return Index
International Developed: MSCI EAFE Net Total Return USD Index
Emerging Markets: MSCI Emerging Markets Net Total Return USD Index
U.S. Equity REITs: FTSE Nareit Equity REITs Total Return Index USD
Commodities: Bloomberg Commodity Total Return Index
Hedge Funds: Hedge Fund Research HFRI Fund of Funds Composite Index
Foreign Bond: Bloomberg Global Aggregate x USD Total Return Unhedged
U.S. Core Bond: Bloomberg U.S. Aggregate Total Return Index USD
U.S. High Yield: Bloomberg US Corporate High Yield Total Return Index USD
U.S. MBS: Bloomberg U.S. MBS (30Y) Total Return Index
U.S. All Cap: Russell 3000 Total Return Index
U.S. Large Cap: Russell 1000 Total Return Index
U.S. Small Cap: Russell 2000 Total Return Index
US Value: Russell 3000 Value Total Return Index
US Growth: Russell 3000 Growth Total Return Index
International Developed All Cap: MSCI EAFE IMI Net Total Return USD Index
International Developed Large Cap: MSCI EAFE Large Cap Net Total Return USD Index
International Developed Small Cap: MSCI EAFE Small Cap Net Total Return USD Index
International Developed Value: MSCI EAFE Value Net Total Return USD Index
International Developed Growth: MSCI EAFE Growth Net Total Return USD Index
Emerging Markets All Cap: MSCI Emerging Markets IMI Net Total Return USD Index
Emerging Markets Large Cap: MSCI Emerging Markets Large Cap Net Total Return USD Index
Emerging Markets Small Cap: MSCI Emerging Markets Small Cap Net Total Return USD Index
Emerging Markets Value: MSCI Emerging Markets Value Net Total Return USD Index
Emerging Markets Growth: MSCI Emerging Markets Growth Net Total Return USD Index
Marketable Alternatives: HFN Hedge Fund Aggregate Average
Private Equity: Cambridge Associates U.S. Private Equity Index
The information contained herein is confidential and the dissemination or distribution to any other person without the prior approval of Fiducient Advisors is strictly prohibited. Information has been obtained from sources believed to be reliable, though not independently verified. Any forecasts are hypothetical and represent future expectations and not actual return volatilities and correlations will differ from forecasts. This report does not represent a specific investment recommendation. The opinions and analysis expressed herein are based on Fiducient Advisor research and professional experience and are expressed as of the date of this report. Please consult with your advisor, attorney and accountant, as appropriate, regarding specific advice. Past performance does not indicate future performance and there is risk of loss.
