Interest Rate Challenges into Opportunities
Key Observations
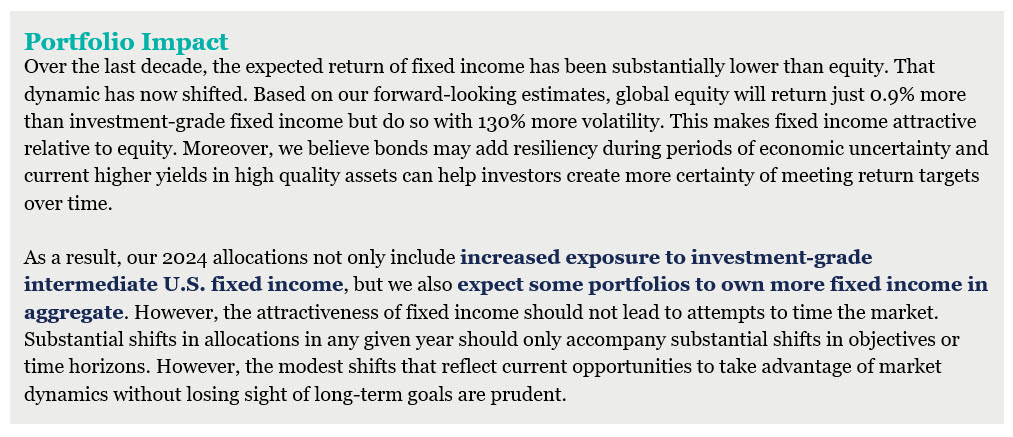
• Our 10-year return forecasts show increased opportunity across fixed income and real assets with a modest step back for equities. This makes for one of the more attractive risk-adjusted returns for fixed income relative to equity we have seen in several years.
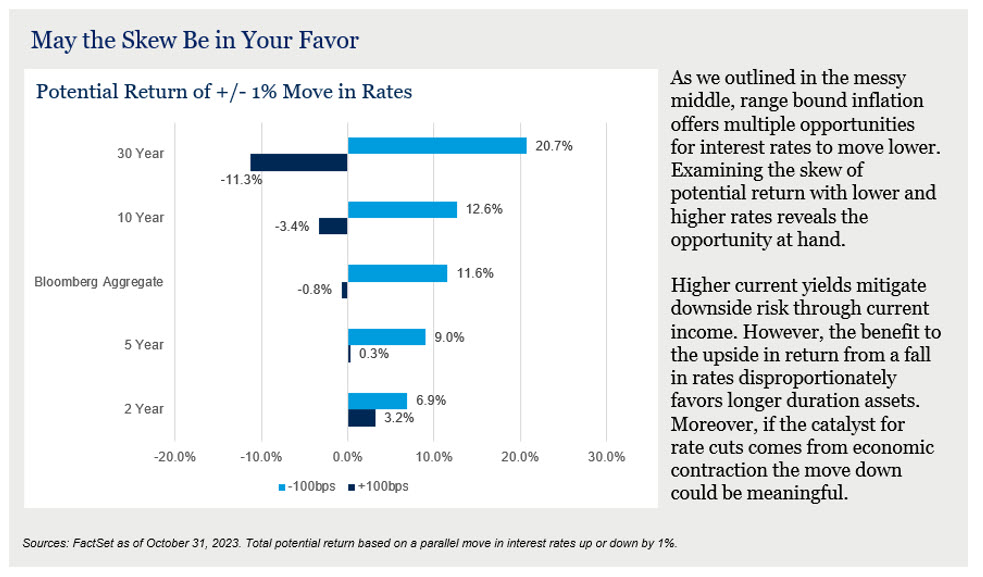
• We believe range-bound inflation opens multiple paths to lower rates creating opportunities for tailwinds in fixed income and more rate-sensitive assets.
• The most predicted recession in history continues to shift into the future, however, we also believe investor mindsets should shift from predict to prepare as risks remain acute and market timing futile.
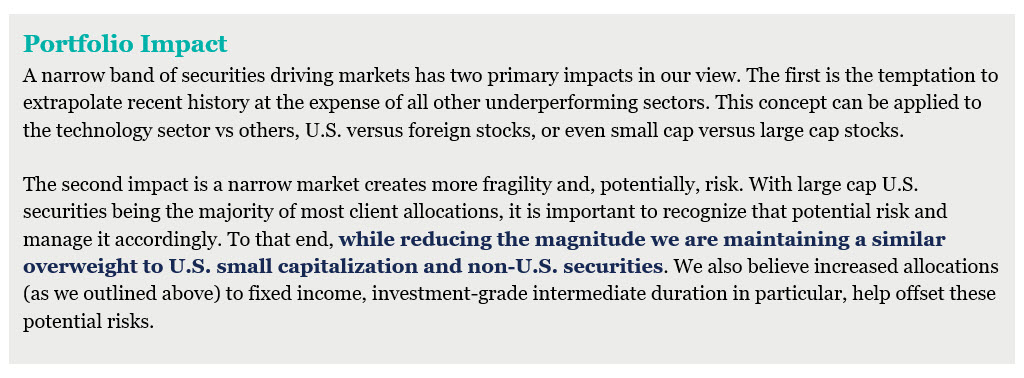
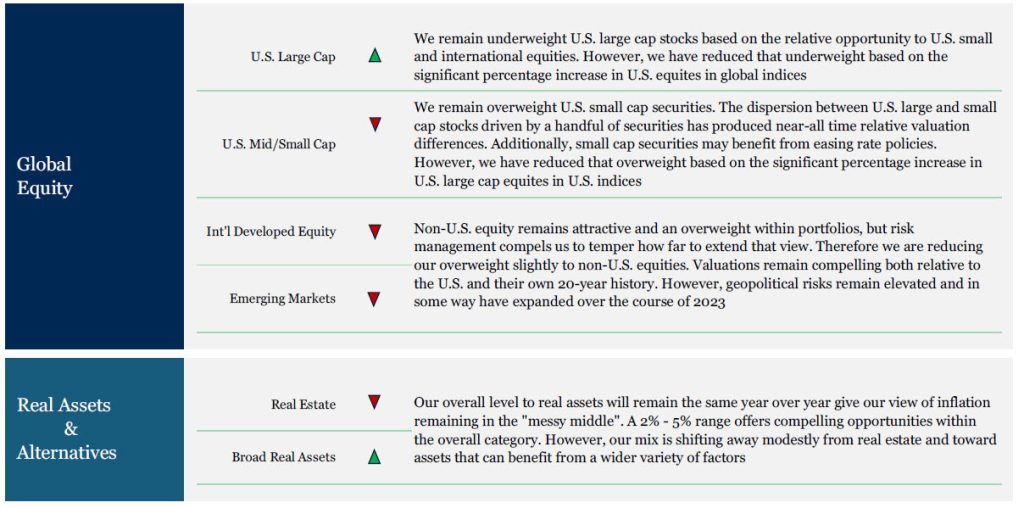
• Narrow market leadership in U.S. equities creates fragility within, and opportunity outside of, U.S. technology stocks. We believe long-term investors will benefit from exposure to U.S. small capitalization and non-U.S. stocks.
Last year we penned our cautiously optimistic outlook, Goodbye Tina, with three primary themes that would influence asset prices in 2023. By and large, our expectations came to fruition. Continued volatility was clearly on display with interest rate volatility not seen since the Global Financial Crisis and while headline equity volatility didn’t set new records, the subtext is important. The stark contrast between -100%1 losses seen in select bank failures and the 200%+1 gains with some Artificial Intelligence (AI) hype is enough to make heads spin. Moderating inflation was a resounding call as inflation fell from annualized highs of 9.1% in 2022 to 3.2% in October 2023.1 And then comes the Bear Market Bottom. Equities globally, but the U.S. in particular, rallied from October lows in 2022 to July 2023 highs by 28.3%.1 While our outlook themes made the grade, that is not to say the crystal ball was spotless. A banking crisis, U.S. Debt downgrade, military conflict in the Middle East and an AI super cycle were not on our radar. As we look to 2024, we should all acknowledge that humility remains paramount. Our opinions change as the facts change, we build for resilience and seek to stack the odds in our favor. We are excited to share our views of 2024 and beyond.
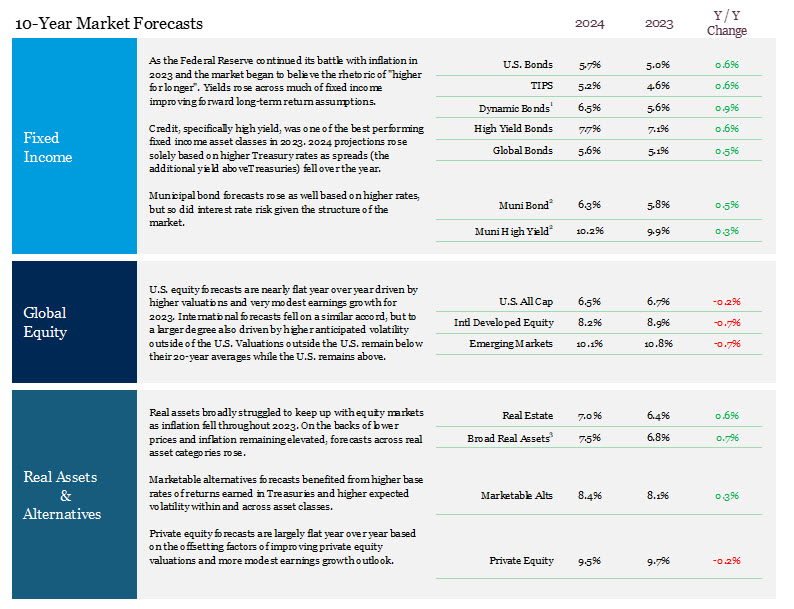
1) Dynamic bonds are a blend of 33% Cash, 33% Corp HY, and 34% Global Bonds. 2) Tax Equivalent yield based on highest marginal Federal tax rate (37%). 3) Broad Real Assets is 20% REITS, 20% Global Infrastructure, 20% Commodities, 20% US Bonds, 15% Corp High Yield, 5% TIPS.
Source: Fiducient Advisors Capital Market Assumptions. Market and economic data including, but not limited to valuations, fixed income yields and inflation are used to derive forecasts. Outputs and opinions are as of the date referenced and are subject to change. Information is intended for general information purposes only and does not represent any specific investment recommendation. Please consult with your advisor, attorney and accountant, as appropriate, regarding specific advice. There is no guarantee that any of these expectations will become actual results. Past performance does not indicate future performance and there is a possibility of a loss.
For additional information on forecast methodologies, please speak with your advisor. Please see Index Proxy Summary information at the end of this paper for summary of indices used to represent each asset class.
2024 Themes
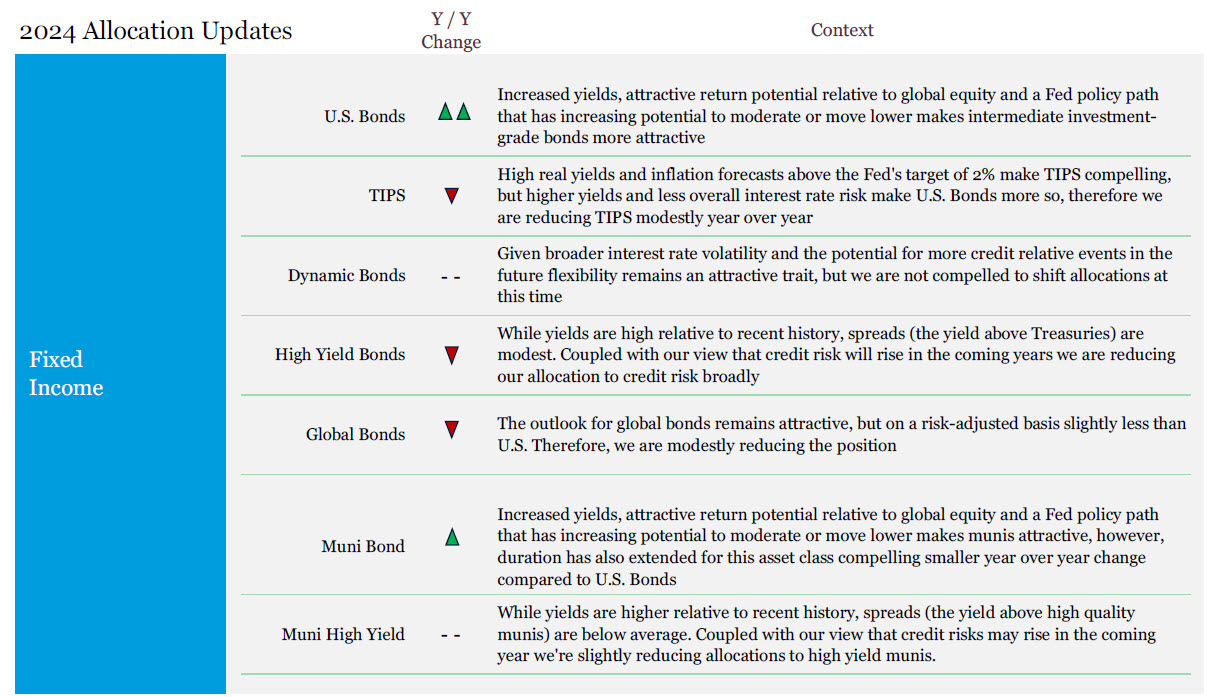
A central thread that pulls through our 2024 themes is a favorable shift toward fixed income; however, increased interest is coupled with moderation. In 2022 we wrote Fixed Income Complacency, a warning for investors who had forgotten the perils of interest rate risks. Over 2022 and 2023, investor views of fixed income shifted from complacency to animosity to indifference. They also reestablished a long-lost relationship with a forgotten asset, cash. Today our 2024 themes, while each distinct and catalyzed by different circumstances, stand in contrast to our earlier writings. What an extraordinary and strange journey fixed income has been on.
The Messy Middle
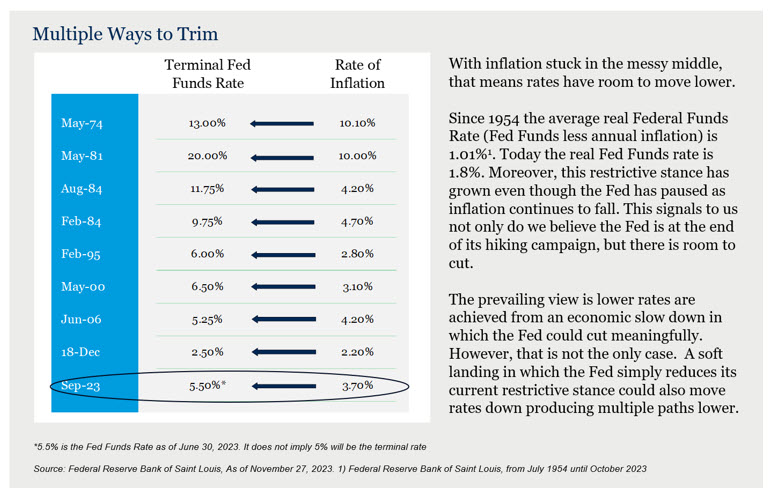
There is a lot of back patting and handshaking that can be done regarding inflation at the Federal Reserve (The Fed). Inflation has fallen from its peak of 9.1% in 2022 to 3.2% in October 2023.1 Some market participants are concerned more work is needed given we remain above the stated 2% average target. Rather, we dismiss 2% as an actual level that must be achieved precisely and believe “normal” inflation is more likely destined to settle higher.
First, 2% is, after all, an arbitrary number. It is far enough away from central bankers’ worst fear, deflation, yet it is below a level of inflation that consumers start noticing (~3%).
Second, it is our view that the Fed is less likely to risk the collateral damage of continued rate hikes, such as adding fragility to the banking system, just for the modest benefit of moving inflation from 3% to 2%. So, if not 2%, what is the target?
We call it the “messy middle”, an inflation range of 2% to 5% and one we believe we will be in for some time. The days of asleep at the wheel 2% inflation where the deflationary tailwinds of globalization are waning. So too are the extraordinary supply-side shocks and consumer revenge spending from COVID.
This range is one that compels vigilance from the Fed that inflation does not rise meaningfully above it, but it is also a range we believe the Fed can use as justification to cease hiking or even begin to cut rates.
Don’t Predict (Recession), Prepare
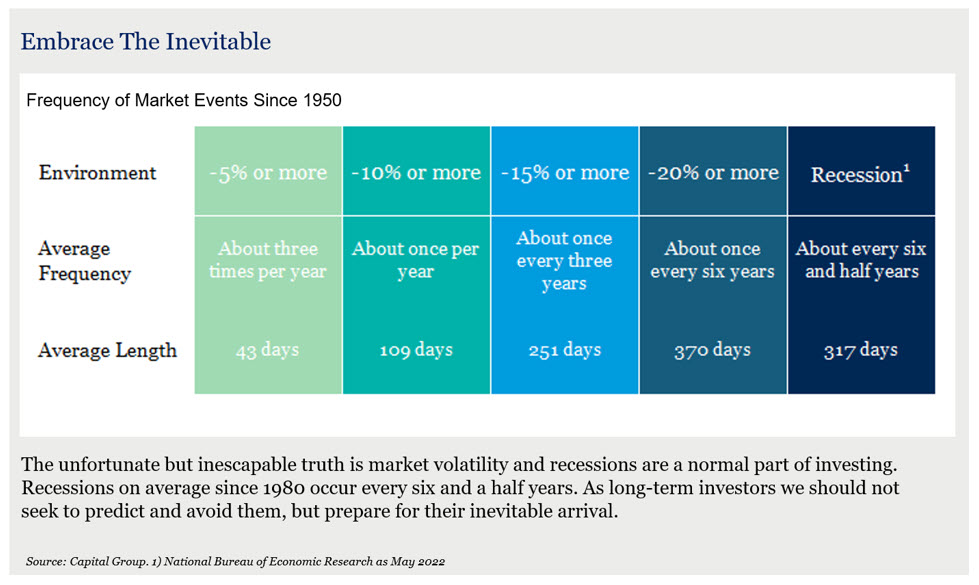
Economists may mark 2023 as one of the greatest head fakes of all time. Bloomberg’s Here is (Almost) Everything Wall Street Expects in 2023 compiled outlooks from 51 institutions, the vast majority of which called for a recession. Quotes like “A recession is all but inevitable” or “2023 will go down as one of the worst for the world economy in four decades”. Yet here we sit with U.S. GDP up 4.7%2 from Q4 2022 to Q3 2023 (the last reported figure). What went wrong? In short, the tenacity of U.S. consumer spending and far better than expected results of putting the inflation genie back in the bottle led the U.S. economy and markets higher. Does that mean victory should be declared on recession and that fear shelved? In a word – no. In fact, if anything the odds of an economic slowdown have increased. However, we should also plainly acknowledge that a recession is always coming. It may be right around the corner or years away, but recessions are a regular part of economic growth and contraction. We believe seeking to time their occurrence is futile. A resilient portfolio shifts the objective from predict to prepare and, in our view, one of the most effective ways to do so today is with intermediate investment-grade bonds.
Concentrated Consequences
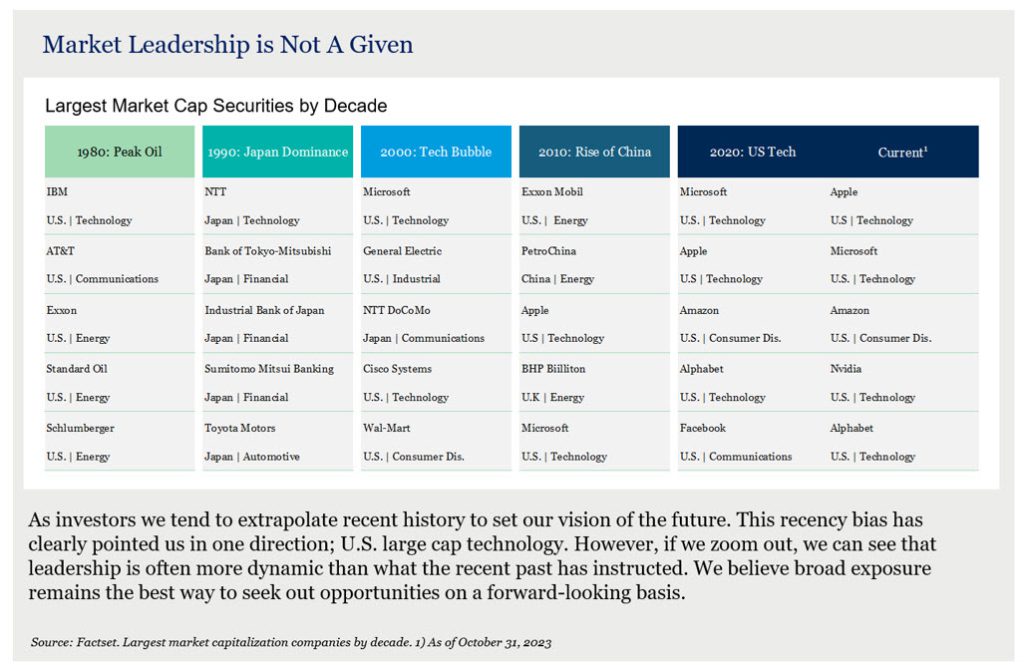
Then came the “Magnificent 7” – Apple, Alphabet (Google), Meta (Facebook), Microsoft, Nividia, Amazon and Tesla. These seven stocks from the S&P 500 were up on average 94%3 year to date through November 2023. If we remove these securities from the S&P 500, through the same period the index would be up ~6%3. The seven securities now make up a record setting 28%4 of the S&P 500 and 48%4 of the growth-oriented Russell 1000 Growth index. A key question is what impact will this narrow group of securities have on future outcomes?It is possible these securities have a repeat performance over the coming years and indices will grow even more unbalanced with a very concentrated group of securities at the top. It is also possible that these securities revert to broader market-level returns and everything else will catch up as markets charge ahead, but concentration dissipates. However, we think a more likely third path over the long-term is that new leadership takes hold making room for sectors, regions or capitalizations that have been left behind over the past decade. Afterall, this is not the first of its kind.
As we demonstrate below, leadership tends to change over time. In 2000 it was the tech bubble, in the 1990s it was Japanese stocks, in the 1980s it was peak oil, in 1972 it was the “Nifty Fifty” and so on. A retort often heard about the Magnificent 7 today is “but these are great companies” and in many cases they are. However, let’s not conflate great businesses and great stocks. Cisco Systems, a gem of the tech bubble, remains one of the world’s most influential technology companies more than 23 years since the tech bubble burst. It also still trades 40%1 below its peak price more than two decades later. Great companies at bad prices can make for bad investments. Additionally, a narrow band of securities contributing to the success of markets intuitively creates more fragility going forward. Much like a sports team, if you lose a star, or multiple star athletes, it is hard to have another step in immediately to take their place.
Portfolio Allocations
Final Thoughts
The long and variable impact of the momentous move up in interest rates is still being felt and to some degree understood. It has also seemingly taken some of the hubris, though perhaps only temporarily, away from the recession prognosticators. These changes have many important implications for asset prices and the economy. If we step back though, we quickly realize this is a good problem to have. Long-term investors seeking reasonable rates of return no longer must do so by continually extending risk. This was a hallmark of the last decade in which extreme interest rate policies at times produced extreme allocations. As market opportunities “normalize” (if we dare say there is such a thing as a normal market) investors may choose to normalize their allocations with perhaps a more modest risk posture. As we noted, it is important to draw the line between updating portfolios to reflect current opportunities and trying to time the market.
For more information, please contact any of the professionals at Fiducient Advisors.
1 FactSet as of November 30, 2023
2 BLS as of November 29, 2023
3 Morningstar as of November 30, 2023
4 FactSet as of November 30, 2023, S&P as of November 30, 2023
Disclosures and Index Proxies
This report does not represent a specific investment recommendation. Comparisons to any indices referenced herein are for illustrative purposes only and are not meant to imply that actual returns or volatility will be similar to the indices. Indices cannot be invested in directly. Unmanaged index returns assume reinvestment of any and all distributions and are reported gross of any fees and expenses. Any forecasts represent future expectations and actual returns; volatilities and correlations will differ from forecasts.
When referencing asset class returns or statistics, the following indices are used to represent those asset classes, unless otherwise notes. Each index is unmanaged, and investors can not actually invest directly into an index:
INDEX DEFINITIONS
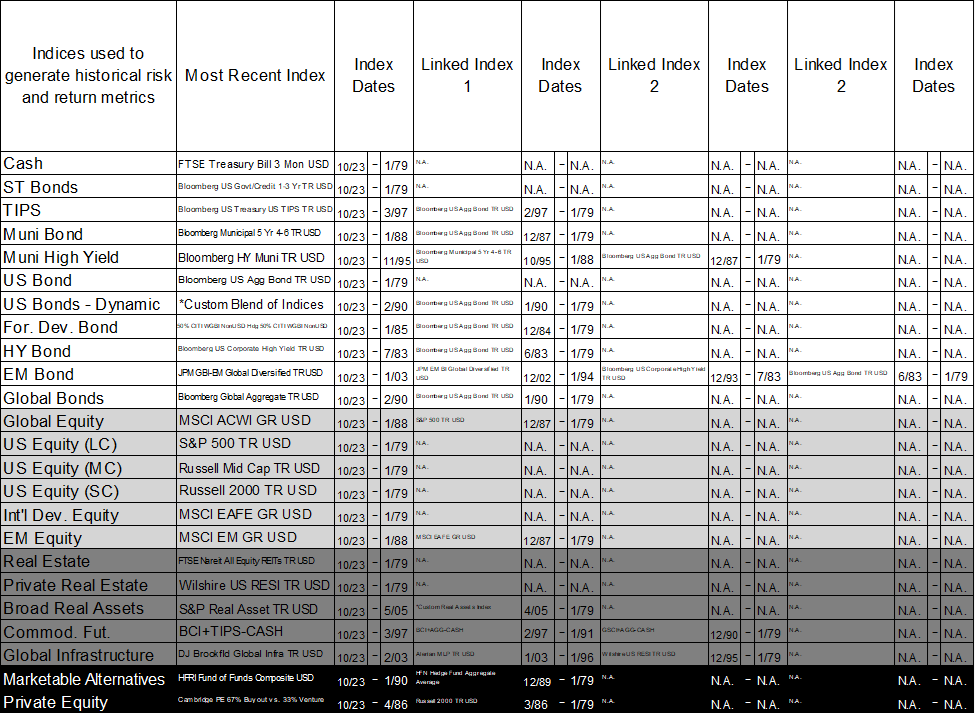
* US Bonds – Dynamic Index – 1/3 Bloomberg Gbl Agg EXUSD TR Hdg USD, 1/3 FTSE Treasury Bill Mon USD & 1/3 Bloomberg US Corporate High Yield TR USD
FTSE Treasury Bill 3 Month measures return equivalents of yield averages and are not marked to market. It is an average of the last three three-month Treasury bill month-end rates.
Bloomberg Capital US Treasury Inflation Protected Securities Index consists of Inflation-Protection securities issued by the U.S. Treasury.
Bloomberg Muni 5 Year Index is the 5 year (4-6) component of the Municipal Bond index.
Bloomberg High Yield Municipal Bond Index covers the universe of fixed rate, non-investment grade debt.
Bloomberg U.S. Aggregate Index covers the U.S. investment grade fixed rate bond market, with index components for government and corporate securities, mortgage pass-through securities, and asset-backed securities.
FTSE World Government Bond Index (WGBI) (Unhedged) provides a broad benchmark for the global sovereign fixed income market by measuring the performance of fixed-rate, local currency, investment-grade sovereign debt from over 20 countries,
FTSE World Government Bond Index (WGBI) (Hedged) is designed to represent the FTSE WGBI without the impact of local currency exchange rate fluctuations.
Bloomberg US Corporate High Yield TR USD covers the universe of fixed rate, non-investment grade debt. Eurobonds and debt issues from countries designated as emerging markets (sovereign rating of Baa1/BBB+/BBB+ and below using the middle of Moody’s, S&P, and Fitch) are excluded, but Canadian and global bonds (SEC registered) of issuers in non-EMG countries are included.
JP Morgan Government Bond Index-Emerging Market Index (GBI-EMI) is a comprehensive, global local emerging markets index, and consists of regularly traded, liquid fixed-rate, domestic currency government bonds to which international investors can gain exposure.
JPMorgan EMBI Global Diversified is an unmanaged, market-capitalization weighted, total-return index tracking the traded market for U.S.-dollar-denominated Brady bonds, Eurobonds, traded loans, and local market debt instruments issued by sovereign and quasi-sovereign entities.
MSCI ACWI is designed to represent performance of the full opportunity set of large- and mid-cap stocks across multiple developed and emerging markets, including cross-market tax incentives.
The S&P 500 is a capitalization-weighted index designed to measure performance of the broad domestic economy through changes in the aggregate market value of 500 stocks representing all major industries.
Russell 3000 is a market-cap-weighted index which consists of roughly 3,000 of the largest companies in the U.S. as determined by market capitalization. It represents nearly 98% of the investable U.S. equity market.
Russell Mid Cap measures the performance of the 800 smallest companies in the Russell 1000 Index.
Russell 2000 consists of the 2,000 smallest U.S. companies in the Russell 3000 index.
MSCI EAFE is an equity index which captures large and mid-cap representation across Developed Markets countries around the world, excluding the US and Canada. The index covers approximately 85% of the free float-adjusted market capitalization in each country.
MSCI Emerging Markets captures large and mid-cap representation across Emerging Markets countries. The index covers approximately 85% of the free-float adjusted market capitalization in each country
The Wilshire US Real Estate Securities Index (Wilshire US RESI) is comprised of publicly-traded real estate equity securities and designed to offer a market-based index that is more reflective of real estate held by pension funds.
Alerian MLP Index is a float adjusted, capitalization-weighted index, whose constituents represent approximately 85% of total float-adjusted market capitalization, is disseminated real-time on a price-return basis (AMZ) and on a total-return basis.
Bloomberg Commodity Index (BCI) is calculated on an excess return basis and reflects commodity futures price movements. The index rebalances annually weighted 2/3 by trading volume and 1/3 by world production and weight-caps are applied at the commodity, sector and group level for diversification.
Treasury Inflation-Protected Securities (TIPS) are Treasury bonds that are indexed to inflation to protect investors from the negative effects of rising prices. The principal value of TIPS rises as inflation rises.
HFRI Fund of Funds Composite is an equal-weighted index consisting of over 800 constituent hedge funds, including both domestic and offshore funds.
Cambridge Associates U.S. Private Equity Index (67% Buyout vs. 33% Venture) is based on data compiled from more than 1,200 institutional-quality buyout, growth equity, private equity energy, and mezzanine funds formed between 1986 and 2015.
HFN Hedge Fund Aggregate Average is an equal weighted average of all hedge funds and CTA/managed futures products reporting to the HFN Database. Constituents are aggregated from each of the HFN Strategy Specific Indices.
Goldman Sachs Commodity Index (GSCI) is a broadly diversified, unleveraged, long-only composite index of commodities that measures the performance of the commodity market.
Material Risks Disclosures
Fixed Income securities are subject to interest rate risks, the risk of default and liquidity risk. U.S. investors exposed to non-U.S. fixed income may also be subject to currency risk and fluctuations.
Cash may be subject to the loss of principal and over longer period of time may lose purchasing power due to inflation.
Domestic Equity can be volatile. The rise or fall in prices take place for a number of reasons including, but not limited to changes to underlying company conditions, sector or industry factors, or other macro events. These may happen quickly and unpredictably.
International Equity can be volatile. The rise or fall in prices take place for a number of reasons including, but not limited to changes to underlying company conditions, sector or industry impacts, or other macro events. These may happen quickly and unpredictably. International equity allocations may also be impact by currency and/or country specific risks which may result in lower liquidity in some markets.
Real Assets can be volatile and may include asset segments that may have greater volatility than investment in traditional equity securities. Such volatility could be influenced by a myriad of factors including, but not limited to overall market volatility, changes in interest rates, political and regulatory developments, or other exogenous events like weather or natural disaster.
Private Equity involves higher risk and is suitable only for sophisticated investors. Along with traditional equity market risks, private equity investments are also subject to higher fees, lower liquidity and the potential for leverage that may amplify volatility and/or the potential loss of capital.
Private Credit involves higher risk and is suitable only for sophisticated investors. These assets are subject to interest rate risks, the risk of default and limited liquidity. U.S. investors exposed to non-U.S. private credit may also be subject to currency risk and fluctuations.
Private Real Estate involves higher risk and is suitable only for sophisticated investors. Real estate assets can be volatile and may include unique risks to the asset class like leverage and/or industry, sector or geographical concentration. Declines in real estate value may take place for a number of reasons including, but are not limited to economic conditions, change in condition of the underlying property or defaults by the borrow.
Marketable Alternatives involves higher risk and is suitable only for sophisticated investors. Along with traditional market risks, marketable alternatives are also subject to higher fees, lower liquidity and the potential for leverage that may amplify volatility or the potential for loss of capital. Additionally, short selling involved certain risks including, but not limited to additional costs, and the potential for unlimited loss on certain short sale positions.
The information contained herein is confidential and the dissemination or distribution to any other person without the prior approval of Fiducient Advisors is strictly prohibited. Information has been obtained from sources believed to be reliable, though not independently verified. Any forecasts are hypothetical and represent future expectations and not actual return volatilities and correlations will differ from forecasts. This report does not represent a specific investment recommendation. The opinions and analysis expressed herein are based on Fiducient Advisor research and professional experience and are expressed as of the date of this report. Please consult with your advisor, attorney and accountant, as appropriate, regarding specific advice. Past performance does not indicate future performance and there is risk of loss.