
Recent narrow market rallies have forced us to focus on market indices and the overall role of the largest stocks. While concentration is hardly a new concern, the contribution to return this year from a handful of big tech stocks (FAAANM) has been staggering. Despite some cause for concern in terms of diversification, concentration itself is not necessarily a bad thing. Additionally, we postulate that dominance often does not last very long, with recent winners usually falling out of favor eventually. Through further analysis, we continue to believe that remaining invested in a thoughtfully diversified portfolio – and allowing the market to pick winners and losers – remains the best strategy over the long term.
Introduction
Index concentration has been a popular topic this year, as investors continue focusing on the disproportionate impact that a few large companies, broadly referred to as “big tech” companies, has had on the markets. The performance of these big tech stocks, which hold a significant weight in the S&P 500 index, accounts for more than all of the S&P 500’s returns through September of this year.
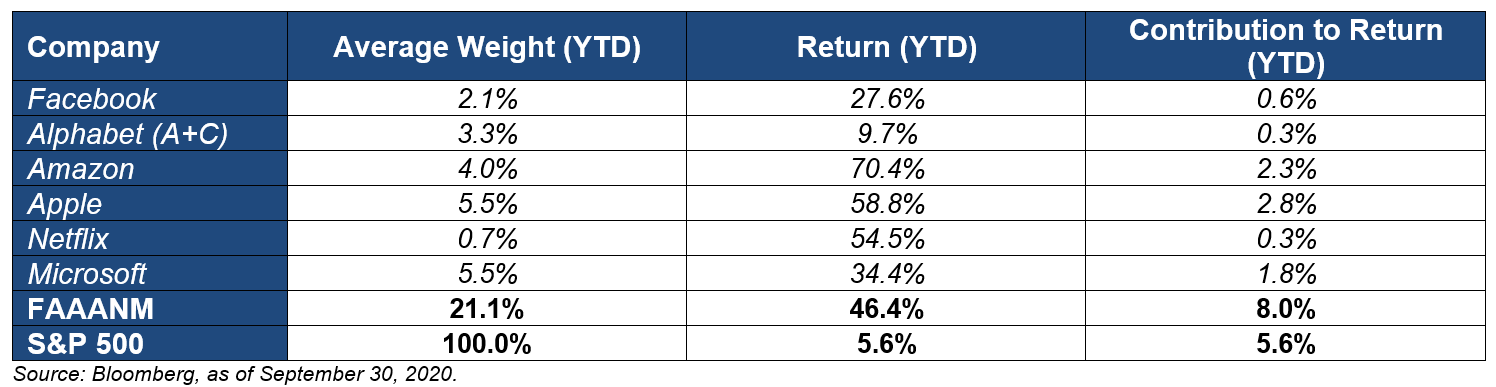
A basket of these large technology companies is often referred to by the acronym FAAANM – Facebook, Alphabet, Amazon, Apple, Netflix and Microsoft. Together, this group has contributed 144.4 percent of the S&P 500’s year to date return. Therefore, the remaining companies that constitute the S&P 500 have, on average, detracted from the overall return with a cumulative weighted average return of -44.4 percent. Merely six stocks have driven this year’s rally, a very top-heavy year for the index.
This staggering statistic raises concerns about portfolio construction, most notably for those with a significant allocation to U.S. large cap equities. With six names driving the majority of the index’s performance over this year, investors might be justified in asking whether owning a diversified basket of securities adds any benefit compared to just holding these six names. However, before making any hasty decisions, you need some context for the narrowness and concentration in the S&P 500 index. There have been similar levels of index concentration before in the sample period, but such levels have been relatively limited in persistence for the largest stocks over time.
Historical Concentration of the S&P 500
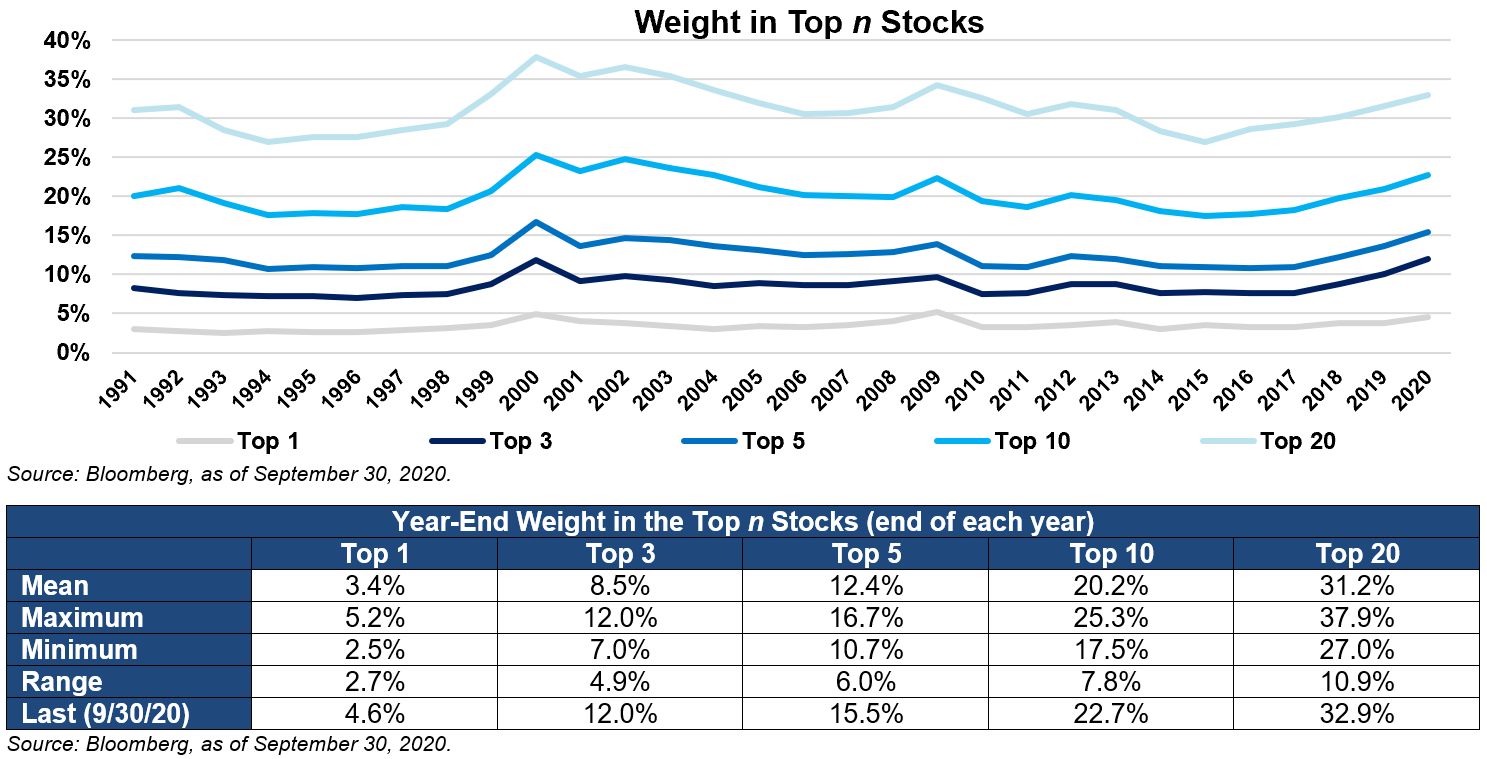
To provide some context around historical index concentration, we looked at the weight of the top 1, 3, 5, 10 and 20 stocks in the S&P 500 at the end of each year from 1990 onwards. The graph and table below illustrate that concentration amongst the top stocks is not a new occurrence and that the level of concentration fluctuated over time. However, this year has seen an elevated level of concentration, with the most recent aggregate weights in all baskets mentioned above, except the top twenty stocks, being significantly higher than their historical means and approaching the historical maximums over the sample period. The top three stocks – Apple, Microsoft and Amazon – reached their highest aggregate weight at any point throughout the sample period.
There has been significant turnover in the top stocks over time, with companies falling out of the top tier after only a few years in that position. Our recent blog post, “Big Stocks Dominate – Will It Last?” explores in detail how, although there are companies that win big, they usually dominate for only a few years and lose their pole position soon thereafter1. Additionally, building a portfolio of recent winners, while tempting, comes with increased risk, both in terms of heightened volatility and drawdown risk. Thus, staying invested in a thoughtfully diversified portfolio remains the best strategy for long-term investors.
1Michael Degnan, ‘Big Tech Stocks Dominate – Will it Last?’ Fiducient Advisors, June 2020
The information contained herein is confidential and the dissemination or distribution to any other person without the prior approval of Fiducient Advisors is strictly prohibited. Information has been obtained from sources believed to be reliable, though not independently verified. Any forecasts are hypothetical and represent future expectations and not actual return volatilities and correlations will differ from forecasts. This report does not represent a specific investment recommendation. The opinions and analysis expressed herein are based on Fiducient Advisor research and professional experience and are expressed as of the date of this report. Please consult with your advisor, attorney and accountant, as appropriate, regarding specific advice. Past performance does not indicate future performance and there is risk of loss.