SpaceX IPO highlights the power of the AI narrative, while a growing pipeline of new issuance may reduce a long-Standing technical tailwind for U.S. equities.
Key Observations
• June offered a constructive test of portfolio diversification. Large cap U.S. stocks and emerging markets softened while small caps, developed market equities, and fixed income produced positive returns.
• The SpaceX IPO was a pivotal moment for private investor liquidity and the first in a growing pipeline of large cap IPO activity.
• Corporate fundamentals remain incredibly healthy but will be relied upon to continue supporting equity markets going forward as a flurry of new equity supply hits the market.
• Strong first-half gains, especially in AI and technology, create an opportunity to reassess exposures, trim concentrated winners, and restore portfolio balance without necessarily reacting to losses.
Market Recap
June brought an uneven tone to global markets as investors balanced still-resilient economic activity against sticky inflation, elevated geopolitical risk and a Federal Reserve that showed a desire to maintain a firmer policy stance. The month also marked a clear shift in market leadership. Large cap U.S. equities paused after a strong spring rally, while small caps, developed international equities and rate-sensitive real assets found support. The S&P 500 Index declined 1.0% in June but remained up 10.2% year to date, while the Russell 2000 Index gained 3.7%, extending its year-to-date advance to 22.6%.
U.S. equity performance reflected a rotation beneath the surface. After several months in which mega-cap technology and AI-related enthusiasm drove much of the market’s advance, investors increased selectivity as inflation data and Fed messaging pushed back against hopes for near-term rate cuts. Small caps benefited from improved breadth, stronger cyclical participation and modest relief in bond yields late in the month. The result was a rare month in which the Russell 2000 meaningfully outpaced the S&P 500, reinforcing the notion that 2026’s equity gains are broadening beyond the largest U.S. companies.
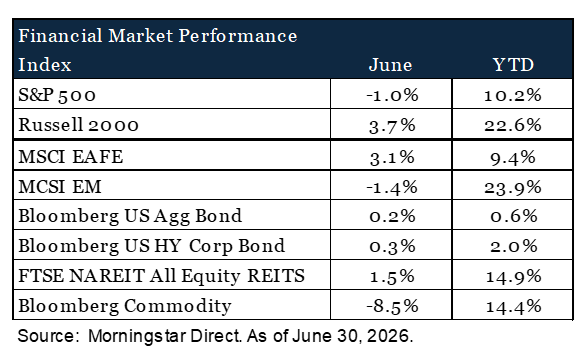
International developed equities also posted solid results. The MSCI EAFE Index returned 3.1% in June and is now up 9.4% year to date, supported by broad participation across non-U.S. developed markets. Emerging markets moved in the opposite direction, with the MSCI EM Index declining 1.4% for the month, though it remains one of the strongest major asset classes in 2026 with a 23.9% year-to-date return. The divergence reflected a more cautious tone toward higher-valuation and geopolitically sensitive markets after a powerful early-year rally, particularly as investors weighed Middle East risks, energy market volatility and an uncertain global policy backdrop.
Fixed income returns were positive but muted. The Bloomberg U.S. Aggregate Bond Index gained 0.2% in June, while the Bloomberg U.S. Corporate High Yield Index returned 0.3%. The Fed held its policy rate steady at its June meeting, with Chair Kevin Warsh emphasizing price stability and removing some of the forward guidance that investors had grown accustomed to in prior cycles. That message landed against a complicated backdrop. May PCE inflation rose to 4.1% year over year while first-quarter GDP was revised higher to 2.1%, underscoring that the economy has not weakened enough to give the Fed a clear opening to cut rates. Credit markets were uneventful, with high yield supported by stable spreads and continued demand for income. Spreads remain very tight, reflecting a high level of optimism and little compensation for adding incremental risk to portfolios.
Real assets were mixed. REITs posted modest gains, with the FTSE NAREIT All Equity REITs Index generating a 1.5% return in June, helped by the late-month decline in yields and a rotation into more rate-sensitive areas of the market. Commodities, by contrast, fell sharply. The Bloomberg Commodity Index declined 8.5% for the month, though it remained up 14.4% year to date. The pullback was driven largely by a reversal in energy prices as markets reassessed the geopolitical risk premium tied to the Iran war and the Strait of Hormuz. While the conflict kept inflation risks elevated earlier in the month, falling oil prices late in June eased some pressure on inflation expectations and provided a partial offset to the Fed’s more cautious policy stance.
Overall, June was not a uniform risk-on month, but it was a constructive test of portfolio diversification. Large cap U.S. stocks softened, commodity prices reversed and emerging markets cooled, yet small caps, developed international equities, core bonds, high yield and REITs all produced positive returns.
SpaceX IPO Marks a Potential Turning Point for Public Market Supply
SpaceX’s highly anticipated IPO was not simply another large technology listing. It was a defining moment for public markets and a clear reflection of the enthusiasm that continues to surround AI, space infrastructure, and the broader ecosystem of companies viewed as enabling the next phase of technological growth. The offering raised roughly $75 billion, making it the largest IPO in history, and shares rose nearly 20% on their first day of trading, lifting SpaceX’s market capitalization above $2 trillion. As the closing bell rang on June 30, SpaceX was the sixth largest U.S. company by market value.
The scale of demand was equally notable. Retail investors reportedly submitted orders far in excess of any prior IPO, with some estimates suggesting retail demand alone exceeded the size of the offering. While institutional participation remained critical, the breadth of individual investor demand underscored how powerful market narratives can become when a company sits at the intersection of several favored themes.
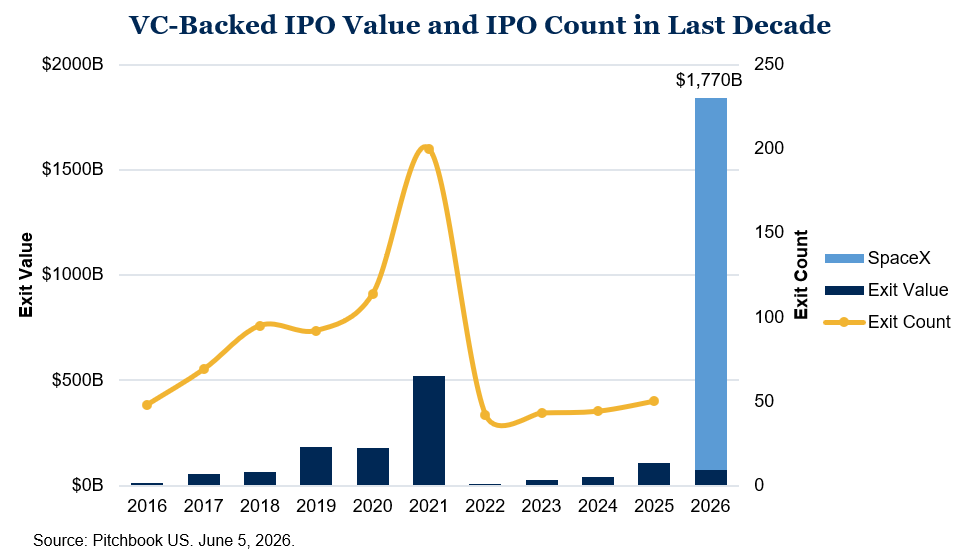
But beyond the public interest in SpaceX as a company, its IPO was also a major liquidity event for private markets. At an estimated IPO value of roughly $75 billion, the SpaceX IPO generated more exit value than all venture-backed IPOs over the last decade combined. Following several years of subdued exit activity for private investors, it was also a signal that the public market window has reopened for the largest private companies.
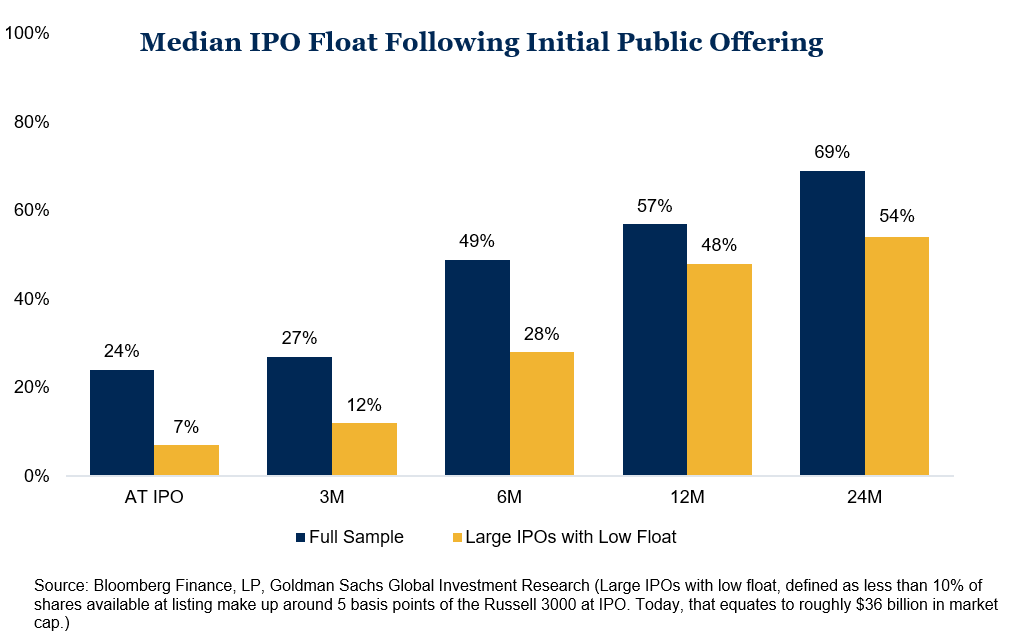
The SpaceX IPO is likely the first in a broader wave of large private companies expected to come public over the next year, including OpenAI, Anthropic, Databricks and others. Each of those companies (in addition to SpaceX) are expected to list though at a relatively low initial float value. Historically, large IPOs with limited float represented only a small share of the market at the time of listing, but the amount of freely tradable equity tends to rise materially as lockups expire and secondary sales develop. According to Goldman Sachs Global Investment Research, large IPOs with limited initial float can see shares in circulation rise from roughly 7% at the IPO to approximately 54% within two years.
That dynamic has important implications for market supply. For much of the last decade, U.S. equities benefited from steady buyback activity, as companies retired more shares than new issuance added back to the market. It created a technical tailwind by supporting earnings per share growth and absorbing available equity supply. A wave of mega-cap IPOs, combined with accelerating share issuance from hyperscalers seeking to fund additional AI capital spending, could move net issuance closer to neutral. Depending on the scale, this would reduce, or potentially eliminate, a long-standing source of market support. That does not necessarily imply a negative outlook for equities, but it does place greater emphasis on fundamentals to drive future gains. Encouragingly, earnings growth – perhaps the most important component of the fundamental picture – remains incredibly robust, with S&P earnings increasing by more than 28% year over year in the first quarter.
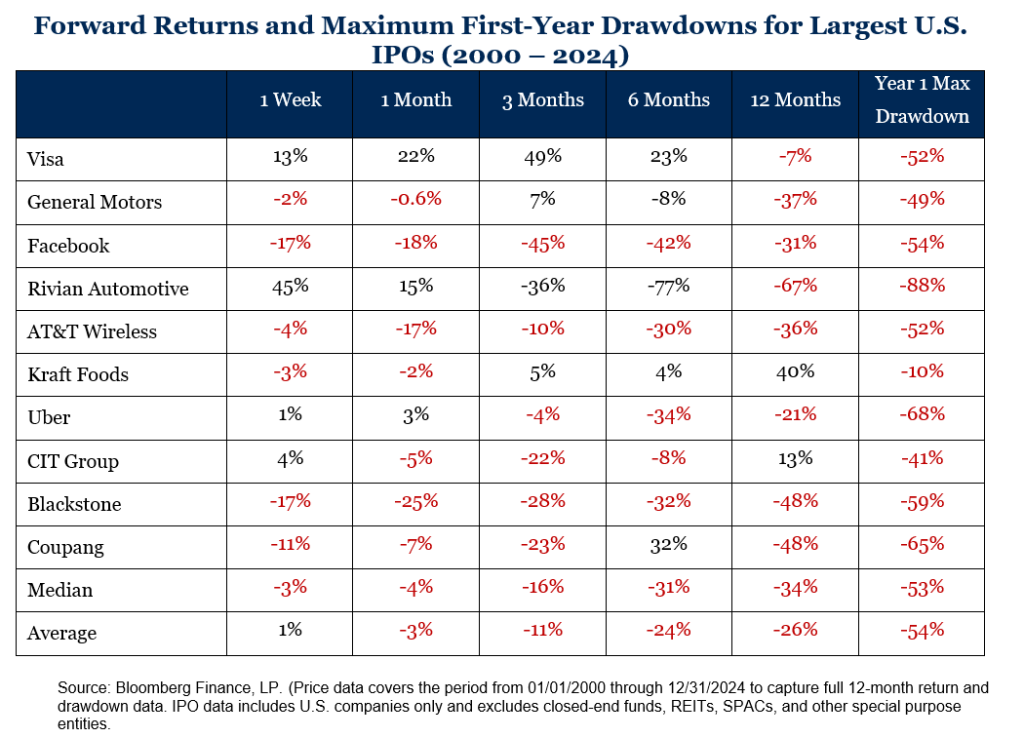
The third and final consideration is performance. IPOs often arrive when investor enthusiasm is high, but historical returns have been more mixed after the initial excitement fades. In a sampling of the 10 largest U.S. IPOs since 2000, each experienced a drawdown of at least 10% within its first year of trading, with a median maximum drawdown exceeding 50%. While this is a limited sample, it reinforces how even the largest, high-profile public offerings were historically accompanied by significant volatility. That does not mean SpaceX or the next generation of listings will follow the same path, but it does argue for selectivity as the IPO calendar becomes active.
Ultimately, the SpaceX IPO carries significance for a variety of different reasons. It confirmed that investor appetite for transformative technology companies remains extremely strong. It also provided a long-awaited liquidity opportunity for private market investors. But it might also mark the beginning of a new phase in which public markets will be asked to absorb a larger amount of equity supply. Ultimately, the IPO pipeline bears watching because it signals a meaningful shift in the balance between equity supply and demand, and a potential change in one of the more durable technical supports for U.S. stocks.
Outlook
As we enter the second half of 2026, investors are presented with an opportune time to rebalance portfolios. Diversification shone during the first six months of the year, but those who were heavily allocated to the narrow themes of AI and technological innovation were not necessarily punished. This leaves a potential opportunity to re-assess portfolio positioning and ensure proper balance in portfolios.
For equity markets, the back half of 2026 will present challenges both new and old, including an increase in net equity supply, uncertainty surrounding monetary policy, and geopolitical risks. At the same time, corporate fundamentals remain supportive, and broader market participation could help reduce the dependence on a small group of mega-cap leaders.
Fixed income also continues to offer a more compelling role than it has in much of the past decade, making it easier for investors to justify diversifying beyond equities. Elevated yields provide income, ballast, and a cushion against modest rate volatility, even as the Fed navigates a difficult mix of persistent inflation and uneven growth. In this environment, disciplined rebalancing, broad diversification, and a focus on long-term objectives remain the most reliable tools for managing uncertainty.
Disclosures & Definitions
Comparisons to any indices referenced herein are for illustrative purposes only and are not meant to imply that actual returns or volatility will be similar to the indices. Indices cannot be invested in directly. Unmanaged index returns assume reinvestment of any and all distributions and do not reflect our fees or expenses. Market returns shown in text are as of the publish date and source from Morningstar or FactSet unless otherwise listed.
- The S&P 500 is a capitalization-weighted index designed to measure performance of the broad domestic economy through changes in the aggregate market value of 500 stocks representing all major industries.
- Russell 2000 consists of the 2,000 smallest U.S. companies in the Russell 3000 index.
- MSCI EAFE is an equity index which captures large and mid-cap representation across Developed Markets countries around the world, excluding the U.S. and Canada. The index covers approximately 85% of the free float-adjusted market capitalization in each country.
- MSCI Emerging Markets captures large and mid-cap representation across Emerging Markets countries. The index covers approximately 85% of the free-float adjusted market capitalization in each country.
- Bloomberg U.S. Aggregate Index covers the U.S. investment grade fixed rate bond market, with index components for government and corporate securities, mortgage pass-through securities, and asset-backed securities.
- Bloomberg U.S. Corporate High Yield Index covers the universe of fixed rate, non-investment grade debt. Eurobonds and debt issues from countries designated as emerging markets (sovereign rating of Baa1/BBB+/BBB+ and below using the middle of Moody’s, S&P, and Fitch) are excluded, but Canadian and global bonds (SEC registered) of issuers in non-EMG countries are included.
- FTSE NAREIT Equity REITs Index contains all Equity REITs not designed as Timber REITs or Infrastructure REITs.
- Bloomberg Commodity Index is calculated on an excess return basis and reflects commodity futures price movements. The index rebalances annually weighted 2/3 by trading volume and 1/3 by world production and weight-caps are applied at the commodity, sector and group level for diversification.
Material Risks
- Fixed Income securities are subject to interest rate risks, the risk of default and liquidity risk. U.S. investors exposed to non-U.S. fixed income may also be subject to currency risk and fluctuations.
- Cash may be subject to the loss of principal and over longer periods of time may lose purchasing power due to inflation.
- Domestic Equity can be volatile. The rise or fall in prices take place for a number of reasons including, but not limited to changes to underlying company conditions, sector or industry factors, or other macro events. These may happen quickly and unpredictably.
- International Equity can be volatile. The rise or fall in prices take place for a number of reasons including, but not limited to changes to underlying company conditions, sector or industry impacts, or other macro events. These may happen quickly and unpredictably. International equity allocations may also be impacted by currency and/or country specific risks which may result in lower liquidity in some markets.
- Real Assets can be volatile and may include asset segments that may have greater volatility than investment in traditional equity securities. Such volatility could be influenced by a myriad of factors including, but not limited to overall market volatility, changes in interest rates, political and regulatory developments, or other exogenous events like weather or natural disaster.
- Private Real Estate involves higher risk and is suitable only for sophisticated investors. Real estate assets can be volatile and may include unique risks to the asset class like leverage and/or industry, sector or geographical concentration. Declines in real estate value may take place for a number of reasons including, but are not limited to economic conditions, change in condition of the underlying property or defaults by the borrower.
- All investing involves risk including the potential loss of principal. Market volatility may significantly impact the value of your investments. Recent tariff announcements may add to this volatility, creating additional economic uncertainty and potentially affecting the value of certain investments. Tariffs can impact various sectors differently, leading to changes in market dynamics and investment performance. You should consider these factors when making investment decisions. We recommend consulting with a qualified financial adviser to understand how these risks may affect your portfolio and to develop a strategy that aligns with your financial goals and risk tolerance.
The information contained herein is confidential and the dissemination or distribution to any other person without the prior approval of Fiducient Advisors is strictly prohibited. Information has been obtained from sources believed to be reliable, though not independently verified. Any forecasts are hypothetical and represent future expectations and not actual return volatilities and correlations will differ from forecasts. This report does not represent a specific investment recommendation. The opinions and analysis expressed herein are based on Fiducient Advisor research and professional experience and are expressed as of the date of this report. Please consult with your advisor, attorney and accountant, as appropriate, regarding specific advice. Past performance does not indicate future performance and there is risk of loss.