March hands back the quarter’s gains as the Strait of Hormuz stays shut and inflation anxiety returns
Key Observations
• In March, Markets gave up much of the gains they had generated for the quarter as the Iranian conflict persisted. Stocks sold off on sentiment and rates rose based on inflation concerns.
• U.S. technology stocks, in particular software, pulled back the most as investors perceived advancements in artificial intelligence as a threat to those business models.
• The last day of the quarter ended with optimism that the U.S. and Iran will seek resolution and markets rallied. The motivation for deescalation may be pressure on the homefront with midterms looming, but the robust economic backdrop is resilient enough to absorb the shock while resolution takes shape.
Market Recap
Global stocks retreated in March and the first quarter after a strong start in January and February. The S&P 500 ended the quarter down 4.3% and the Nasdaq Composite fell 6.9%, their worst quarter since 2022. The Iran conflict dominated sentiment from its onset on February 28th. The quarter closed on an encouraging note as green shoots of resolution emerged, and the S&P 500 surged 2.9% on March 31, its best single trading day of 20261.
In the U.S., technology was the hardest-hit sector. Software stocks pulled back on concerns that AI investment would erode their competitive value. Over the last five years, software as a service traded at a 50% premium to the broader market2. That premium has been erased over the last two quarters. The weakness drove a broad rotation into value stocks across every market-cap tier. Large-cap growth lost 9.8%, while large-cap value gained 2.1%. Small-cap value led all segments, rising 5% as investors sought defensively positioned, attractively priced companies.
International stocks held up well by comparison, though March returns softened as the Iran conflict came into focus. For the quarter the MSCI EAFE fell just 1.2% and MSCI Emerging Markets slipped only 0.2%, both comfortably outpacing U.S. markets.
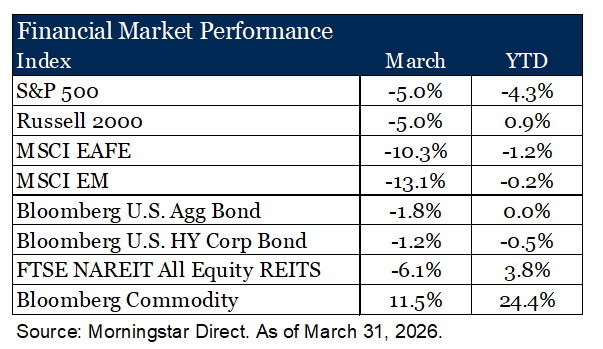
Bond markets offered modest stability. The Bloomberg U.S. Aggregate Bond Index was flat, TIPS rose 0.3% and high yield bonds dipped just 0.5%, cushioned by income. Rates climbed through the quarter on inflation concerns tied to higher energy prices. Markets have largely erased expectations for a Fed cut in 2026, a sentiment we think may be overdone in the short-term.
Lessons from the Suez Canal
To understand where this conflict may be headed, history offers a useful guide.
In the fall of 1956, Egypt nationalized the Suez Canal and as a result Britain and France, joined by Israel, launched Operation Musketeer to take it back. Militarily, it worked. Strategically, it did not. They lost not on the battlefield, but because of political and economic pressures on the home front. Seventy years later, the United States finds itself in a strikingly familiar bind.
Operation Epic Fury has achieved its immediate military aims in Iran. Leadership has been disrupted, missile and drone facilities degraded, and uranium stockpiles reportedly depleted. But the broader strategic goals that these tactical elements signal; an open Strait of Hormuz, more U.S.-friendly Iranian leadership, and regional stability, have not been met. The Strait remains effectively closed and Iran, while militarily weakened, is emboldened.
The Hormuz Problem
Most recognize that gasoline comes from oil. Fewer recognize petrochemicals made from oil and natural gas provide the building blocks for over 95% of all manufactured goods, including plastics, fertilizers, pharmaceuticals and synthetic fibers. The Strait of Hormuz is the artery through which these inputs reach market. Before the conflict, roughly 21 million barrels per day moved through it, approximately 18% of global supply3. As a result of its closure WTI crude oil prices have risen 50% from pre-war levels and non-U.S. grades have risen by 100% or more over the first quarter. The economic toll for such disruption is acute. The Dallas Federal Reserve recently estimated if the Strait remained closed for the remainder of 2026 it would reduce real global GDP growth by 1.3%, roughly equivalent to Mexico’s entire economy going dark for a year4.
Motivated Resolution
The U.S. midterm elections are nearing and the voting topic du jour is affordability. Gasoline prices and inflation are not abstract policy debates. They are felt at every fill-up and often find their way into voting booths. Like Britain in 1956, the forcing function is less likely to be the battlefield and more likely to be the pressures at home.
The challenge remains finding a credible exit. According to the Associated Press, Iran’s terms for peace include per-ship tolls on Strait passage, its right to enrich uranium and pursue a nuclear program, and reparations for damages sustained among others. These terms suggest Tehran believes leverage is on its side.
What We’re Watching
Two signals will define the long-term impact of this conflict.
The first is whether Iran tests its leverage over the Strait of Hormuz. Before this conflict, the idea of an Iranian toll on commercial vessels was not a serious risk scenario. It is now. Nearly 140 ships transit the Strait each day. Iran has floated a $2 million levy per vessel. If implemented, that generates over $100 billion in annual revenue, nearly double its current oil export income of $53 billion5. The financial incentive is real. A permanent toll regime would redirect global commodity flows toward China-aligned economies and create lasting friction for Western markets.
The second signal is the extent of damage to energy infrastructure. A swift resolution could reopen the Strait within weeks. But physical damage to production and refining facilities is a different problem. Repairs take months, sometimes years. If supply contracts structurally with no credible alternative to fill the gap, the inflationary pressure this conflict has already created may not resolve when the fighting does.
Green Shoots
On balance, we see genuine reasons for measured optimism. Earnings growth is broadening, powered by AI and defense spending. The Bloomberg Economic Surprise Index sits near its highest level since 2023, and shelter costs, a stubborn driver of core inflation, continue to moderate. Critically, a soft labor market reduces pressure on the Fed to respond to high inflation driven by energy prices. Collectively, these conditions buy time for a diplomatic resolution and create the backdrop under which one can succeed.

Our Positioning
The Suez Crisis resolved in weeks once political will collapsed under domestic pressure. We believe this conflict may follow a similar arc. The forcing function exists, the motivation is acute, and the economic backdrop remains resilient enough to absorb the shock while resolution takes shape. As a result, we are maintaining current positioning and watching evolving conditions closely. Risks remain, chiefly around infrastructure damage and Iran’s willingness to negotiate in good faith, and we are watching both closely.
1Bloomberg as of April 1, 2026
2FactSet as of April 1, 2026
3JPMorgan as of April 6, 2026
4Federal Reserve Bank of Dallas, as of March 20, 2026
5Energy Information Administration (EIA), August 2025
Disclosures & Definitions
Comparisons to any indices referenced herein are for illustrative purposes only and are not meant to imply that actual returns or volatility will be similar to the indices. Indices cannot be invested in directly. Unmanaged index returns assume reinvestment of any and all distributions and do not reflect our fees or expenses. Market returns shown in text are as of the publish date and source from Morningstar or FactSet unless otherwise listed.
- The S&P 500 is a capitalization-weighted index designed to measure performance of the broad domestic economy through changes in the aggregate market value of 500 stocks representing all major industries.
- Russell 2000 consists of the 2,000 smallest U.S. companies in the Russell 3000 index.
- NASDAQ Composite Index measures the performance of all Nasdaq domestic and international based common type stocks listed on the Nasdaq Stock Market. It is a market-capitalization weighted index.
- MSCI EAFE is an equity index which captures large and mid-cap representation across Developed Markets countries around the world, excluding the U.S. and Canada. The index covers approximately 85% of the free float-adjusted market capitalization in each country.
- MSCI Emerging Markets captures large and mid-cap representation across Emerging Markets countries. The index covers approximately 85% of the free-float adjusted market capitalization in each country.
- Bloomberg U.S. Aggregate Index covers the U.S. investment grade fixed rate bond market, with index components for government and corporate securities, mortgage pass-through securities, and asset-backed securities.
- Bloomberg U.S. Corporate High Yield Index covers the universe of fixed rate, non-investment grade debt. Eurobonds and debt issues from countries designated as emerging markets (sovereign rating of Baa1/BBB+/BBB+ and below using the middle of Moody’s, S&P, and Fitch) are excluded, but Canadian and global bonds (SEC registered) of issuers in non-EMG countries are included.
- FTSE NAREIT Equity REITs Index contains all Equity REITs not designed as Timber REITs or Infrastructure REITs.
- Bloomberg Commodity Index is calculated on an excess return basis and reflects commodity futures price movements. The index rebalances annually weighted 2/3 by trading volume and 1/3 by world production and weight-caps are applied at the commodity, sector and group level for diversification.
Material Risks
- Fixed Income securities are subject to interest rate risks, the risk of default and liquidity risk. U.S. investors exposed to non-U.S. fixed income may also be subject to currency risk and fluctuations.
- Cash may be subject to the loss of principal and over longer periods of time may lose purchasing power due to inflation.
- Domestic Equity can be volatile. The rise or fall in prices take place for a number of reasons including, but not limited to changes to underlying company conditions, sector or industry factors, or other macro events. These may happen quickly and unpredictably.
- International Equity can be volatile. The rise or fall in prices take place for a number of reasons including, but not limited to changes to underlying company conditions, sector or industry impacts, or other macro events. These may happen quickly and unpredictably. International equity allocations may also be impacted by currency and/or country specific risks which may result in lower liquidity in some markets.
- Real Assets can be volatile and may include asset segments that may have greater volatility than investment in traditional equity securities. Such volatility could be influenced by a myriad of factors including, but not limited to overall market volatility, changes in interest rates, political and regulatory developments, or other exogenous events like weather or natural disaster.
- Private Real Estate involves higher risk and is suitable only for sophisticated investors. Real estate assets can be volatile and may include unique risks to the asset class like leverage and/or industry, sector or geographical concentration. Declines in real estate value may take place for a number of reasons including, but are not limited to economic conditions, change in condition of the underlying property or defaults by the borrower.
- All investing involves risk including the potential loss of principal. Market volatility may significantly impact the value of your investments. Recent tariff announcements may add to this volatility, creating additional economic uncertainty and potentially affecting the value of certain investments. Tariffs can impact various sectors differently, leading to changes in market dynamics and investment performance. You should consider these factors when making investment decisions. We recommend consulting with a qualified financial adviser to understand how these risks may affect your portfolio and to develop a strategy that aligns with your financial goals and risk tolerance.
The information contained herein is confidential and the dissemination or distribution to any other person without the prior approval of Fiducient Advisors is strictly prohibited. Information has been obtained from sources believed to be reliable, though not independently verified. Any forecasts are hypothetical and represent future expectations and not actual return volatilities and correlations will differ from forecasts. This report does not represent a specific investment recommendation. The opinions and analysis expressed herein are based on Fiducient Advisor research and professional experience and are expressed as of the date of this report. Please consult with your advisor, attorney and accountant, as appropriate, regarding specific advice. Past performance does not indicate future performance and there is risk of loss.