
Key Observations
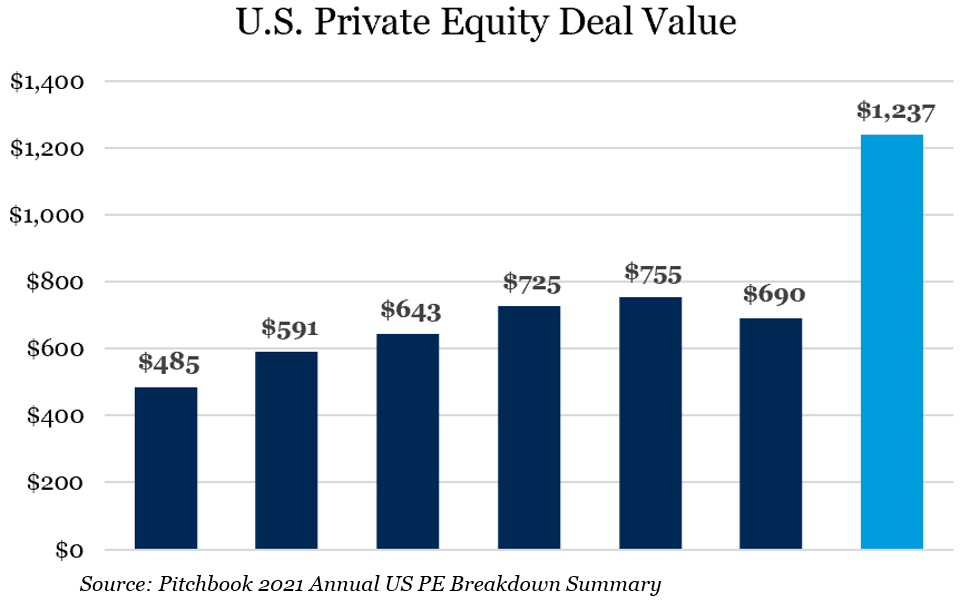
• Annual deal activity surpassed historical highs as total private equity deal value reached approximately $1.2 trillion, nearly twice that of 2020.1
• Funds continued to increase as both buyout and venture managers returned to market quicker and raised funds at a heightened level relative to their prior fund size.
• Performance soared as multiples expanded; revenue and earnings grew; and debt magnified returns in an enduring low interest rate environment.
Introduction
Private markets had a stellar year in 2021, with eye-popping metrics across performance, fundraising and deal-making. The past year benefitted from deals and fundraising postponed from 2020 to 2021 while potential tax consequences created an urgency to close deals before year end. As equity valuations continued to climb across the globe and fixed income yields remained low, investors increasingly turned to alternative asset classes, and specifically private equity, to reach return targets. While the data and performance are overwhelmingly positive, there are risks worth noting as we progress into 2022 including:
• The ability of fund managers to invest the capital they have raised
• Sky-high inflation
• Geopolitical tensions
• Higher asset prices fueled by dry powder and low interest rates
Fundraising Activity
Although fundraising in 2021 did not break any records, it still was quite robust. As the market failed to meet investors’ expectations, many of them sought alternatives to bridge the gap. In all, approximately 400 funds raised slightly more than $300 billion in U.S. Private Equity.2 While this outpaced 2020, which was largely quiet in the second quarter, it did not surpass fundraising in 2019.
Not surprisingly, funds increased to the largest amount of capital raised per fund since 2007. Funds raising more than $1 billion accounted for nearly 80 percent of total capital raised during the year and mega funds, larger than $5 billion, accounted for about less than half of the capital raised. Some names at the top of that list include Hellman & Friedman, which raised $25 billion and Silver Lake, which raised $20 billion for their flagship, while CD&R ($16 billion), TA ($12.5 billion) and Bain ($12 billion) all contributed to those numbers significantly.3
This trend does not appear to be slowing in 2022 as many firms are reportedly expected to be in market with larger funds once again. According to Forbes and Bloomberg, Blackstone could be eyeing a $30 billion fund size for its next flagship while Carlyle targets $27 billion. Immediately proceeding in order are Apollo ($25 billion), Vista ($24 billion) and Thoma Bravo ($22 billion).4 The chart below highlights the percentage of funds closing that are over one billion in size relative to their smaller fund counterparts.
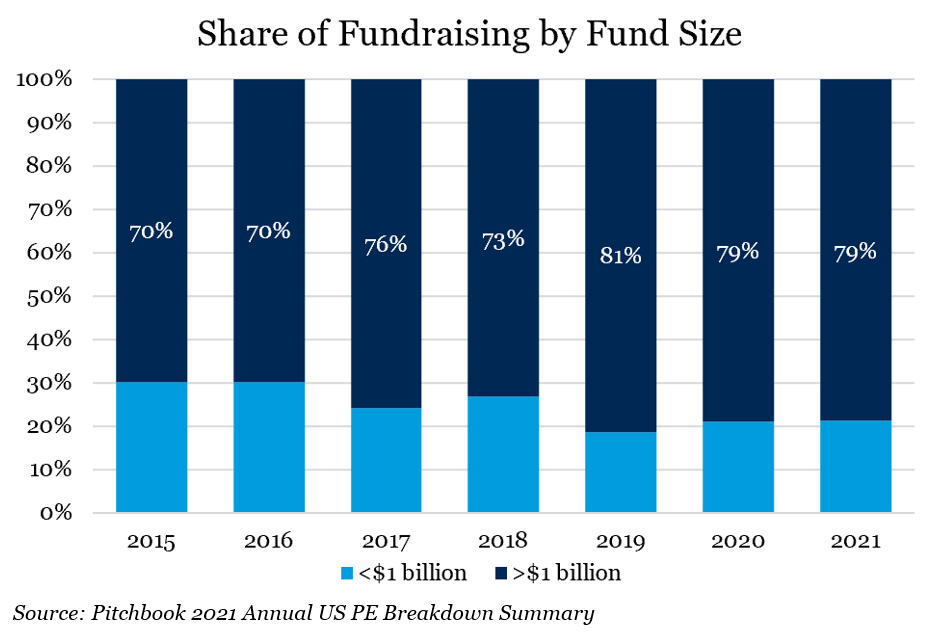
Overall, the competition for deals at the larger end of the market continues to be fierce and is showing few signs of stalling. Larger funds will need larger deals. While the value and count of deals greater than $1 billion increased by 90 percent and 62 percent, respectively, these deals represented only 27 percent of deal value and 2 percent of deal count.5 This has led to an increase in syndication or “club” deals among funds that inevitably compete with each other for the same deals.
While fundraising is strong within buyout and growth equity, fundraising in venture is staggering as it eclipsed $128 billion, almost 50 percent higher than the next highest year on record (2020, $87 billion).6 Like buyout and growth equity, the increase in capital raised came from larger funds rather than more funds in market. Strong performance within the venture market compounded by the robust exit market (via IPO and SPAC acquisition) triggered exceptional liquidity over the past several years.
Dealmaking
Deal activity exploded in 2021 due to a confluence of events. This partially stemmed from a large amount of pent-up demand for deals that stemmed from a “pencils down” environment for part of 2020. This delayed many transactions planned for 2020, causing them to close at the turn of the calendar. Additionally, there was the overhang of potential tax changes and subsequently higher tax bills for would-be sellers upon exit. While the latter turned out to be noise, it was nonetheless a frequently cited reason for urgency. At the end of the year, deal value surpassed $1.2 trillion, easily exceeding the previous record of $765 billion set in 2007.7 Software and healthcare continued to be the most active sectors in the market as COVID lingered in many conversations, seeming more resilient and therefore valuable. Software deal activity among buyout and growth equity (not including venture) was 40 percent higher by count and more than 70 percent greater by overall deal value than in 2020, highlighting the appetite for the space.8 On the other end of the spectrum, energy, which has historically been around 10 percent of total deal value, was just 3 percent in 2021 , tracing how capital has fled the space after a volatile decade as well as a noted energy transition that is very clearly underway across the globe.
1Pitchbook 2021 Annual US PE Breakdown Summary
2Pitchbook 2021 Annual US PE Breakdown Summary
3Pitchbook 2021 Largest Mega Funds in Private Equity
4Forbes and Bloomberg
5Pitchbook 2021 Annual US PE Breakdown Summary
6Pitchbook 2021 Record Year in US Venture Capital
7Pitchbook 2021 Annual US PE Breakdown Summary
8Pitchbook 2021 Annual US PE Breakdown Summary
The information contained herein is confidential and the dissemination or distribution to any other person without the prior approval of Fiducient Advisors is strictly prohibited. Information has been obtained from sources believed to be reliable, though not independently verified. Any forecasts are hypothetical and represent future expectations and not actual return volatilities and correlations will differ from forecasts. This report does not represent a specific investment recommendation. The opinions and analysis expressed herein are based on Fiducient Advisor research and professional experience and are expressed as of the date of this report. Please consult with your advisor, attorney and accountant, as appropriate, regarding specific advice. Past performance does not indicate future performance and there is risk of loss.