Navigating Dispersion for Outperformance
Key Observations
• The full year of 2023 ended the way it started – with lower levels of activity across both fundraising and deal related. A growing list of mature portfolio companies that have not been exited was most notable, leaving investors eagerly anticipating distributions.
• Volatility within venture capital persisted, as many expected, as we saw more non-traditional venture capital investors exit the space (at least for the time being). LPs who had significant exposure to venture have been forced to adjust budgets given lack of distribution and as the “IPO window” has remained closed.
• The private debt markets grew to $1.7 trillion in assets under management during the year; however, this was largely on the push of retail investors, as many of the largest remain minimally involved.
Introduction
After a challenging 2023 – from fundraising to dealmaking – many private markets participants welcomed 2024 with open arms. Buoyed by a strong year in public markets and the (anticipated) end of the road on rate hikes with possible cuts in the forecast, both deal makers and allocators have a renewed optimism and focus. For all the negative sentiment and headlines over the past few years in private markets, one incremental observation is that it is appearing more likely that 2021 (and the first half of 2022) was the anomaly rather than just another leg of growth in the space. While the pace in private markets can be frantic at times, nothing actually happens all that quickly as both sides of the equation continue to settle into whatever “normal” environment we’re currently in. Throughout this annual update we will highlight data from 2023 and explore key topics, drawing insights from the 700+ manager meetings our team conducted last year.2
Fundraising
Global fundraising took another step back from the highs of 2021 regarding both total dollar value of capital raised as well as the number of funds. With many investors hovering around their allocation targets, the pace of deployment has decreased. Limited Partners (“LPs”) collectively are not feeling as much pressure and are better able to work on their own timelines rather than GPs (often artificially) self-imposed timelines. We are observing the “automatic re-up” as a thing of the past as many investors are seeking to shrink their General Partner (“GP”) relationships and concentrate on their highest conviction opportunities.
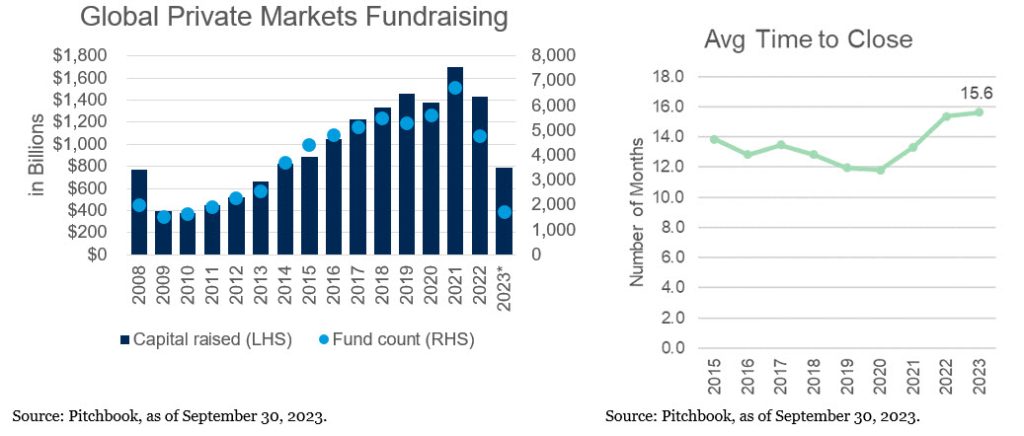
Additionally, we see this shift in the data as well, with the number of funds having their final close shrinking dramatically and the average time to close a fund continuing to creep higher. Even globally, we witness the fastest 25 percent of funds to close still taking two months longer than they did last year.3 As GPs have seen this unfold, they’re generally waiting as long as they can before embarking on their next fundraise. The only segment of the market to have bucked the negative trend in fundraising has been secondaries – a space that under the hood looks drastically different than it did a decade ago.
One statistic in private markets that is frequently cited is the amount of “dry powder” sitting on the sidelines. The nominal value, which is the data point most often noted, has been growing for years as investors spent a long time trying to reach their targets. To do that, they committed more dollars, leaving unfunded commitments not yet invested or “dry powder.” Since 2020, total value of unfunded commitments has been modestly receding from the nominal highs, albeit still north of $3.5 billion.4 But how should this be compared?
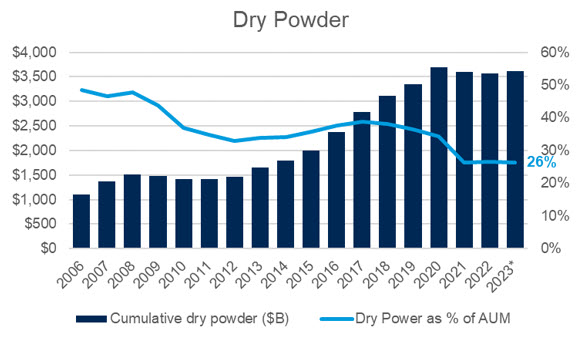
Taking the current uninvested capital relative to the total assets managed by private markets managers today, we see the percentage declining consistently. From this, we conclude that the nominal value of dry powder may not be all that indicative or insightful as to what may lie around the corner. If anything, we can say that, relative to recent history, investors have fewer unfunded liabilities today relative to their current market values than they have had in quite some time.
Deal Activity
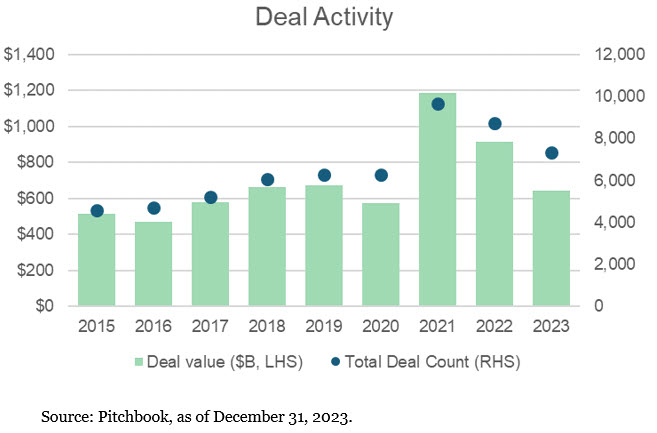
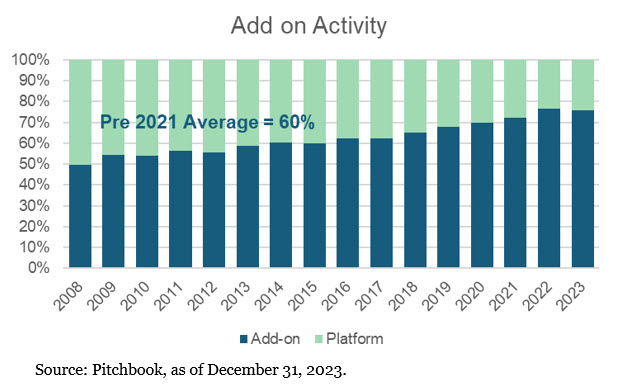
In similar fashion to fundraising, deal activity was lower with levels more akin to six or seven years ago rather than the past few. However, rather than a time when the market is growing meaningfully, GPs are faced with a period that is fighting for footing. As a result of a less robust exit environment (more on that later), the path to trying to encourage company growth is likely attained by executing add-ons.
This accounted for just under 76 percent of U.S. buyout activity last year which is still well above the pre-2021 average of 60 percent.5 There is generally good reason for this: add-ons tend to be smaller deals that often trade at lower multiples and can be financed with either less debt or possibly with the use of existing delayed draw facilities put in place with the platform investment.
One area that has impacted the deal value has been mega-deals, defined as deals greater than $1 billion, which has been cut in half since 2021 (declined of 54 percent by value and 48 percent by count).6 The pullback is not surprising given the reliance on debt to finance those deals and hesitancy of lenders to continue lending at peak valuation levels. The question, however, remains in when this end of the market will pick up.
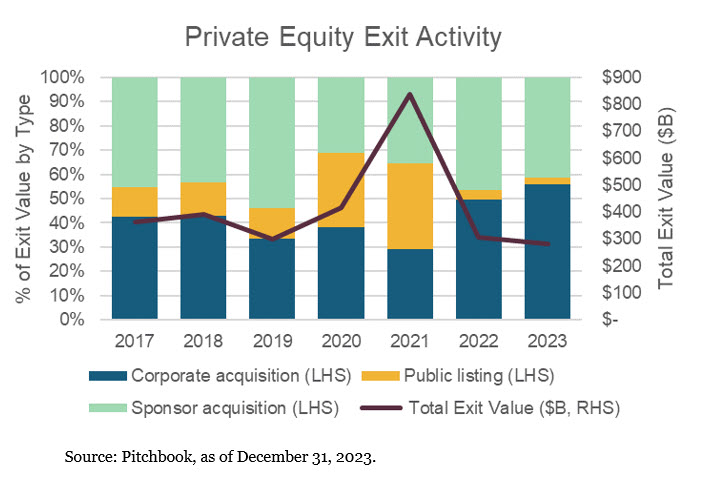
Exit Activity
Exit activity has been the topic du jour for months. In the closed-end fund structure that is private markets, it is required in order to keep the flow of capital moving. U.S. Private Equity exit value for last year was the lowest year since 2012.7 One of the primary reasons is that the IPO market remains closed. Although typically a meaningful component of exit value, particularly given the largest companies tend to exit via IPO, it only accounted for 2.6 percent of exit value last year. That’s the lowest share back to prior to 2008 when the data set starts (it was 5.6 percent in 2008 for reference).8
Given the lack of exits, the rise of less traditional ways to return capital have resulted. One to touch on out of the gate is the dividend recap. While commonly used, it is less so today because the recap to higher interest rates is one that is often less attractive or even untenable for portfolio companies. Another avenue some have turned to is NAV loans. This involves taking a loan against the existing portfolio and returning capital to LPs. Once an exit (eventually) occurs, the GP can then repay the loan – that is, assuming all goes to plan. There are many pain points for LPs in this situation, generally all stemming from additional risk, including the fact that the capital they just received may have to be returned to the GP to repay the loan if things were to go sideways.
Real Assets and Debt
Real estate and real assets continued to be one of the most challenged asset classes from a fundraising standpoint with a combined $86 billion raised globally through the third quarter of 2023.9 With the addition of any fourth quarter closes, it will narrowly top the depths of the financial crisis from a fundraising perspective. While real estate, in particular, has had some very challenged areas – namely, office – the asset class also is home to multifamily and industrial which continue to perform. Most concerning for this space overall is the maturity wall of debt that will be coming due over the next 24 to 36 months. In total, just over $1.6 trillion worth of commercial real estate debt is set to mature over the next three years.10 While there are typically some sort of extensions that borrowers can exercise to provide some flexibility, at some point capital that was borrowed during lower interest rate times will have to be replaced with the prevailing rates. Many of those may require more equity to go in or some sort of structured capital to fill gaps in the capital stack that previously did not exist. In short, there is not a lot suggesting investors will jump off the sidelines anytime soon.
We noted private debt took a step back in total fundraising for the second straight year, despite higher interest rates and a more friendly lending environment relative to recent history. With some traditional banks less actively lending following considerable regional bank volatility, the thought is that private debt will likely continue to fill the gap in the market that was initially spurred by post-financial crisis regulation. But how do we square the circle of less institutional commitments into private debt and private debt seemingly everywhere we turn?
The answer is the push into retail investors in the space via non-traded BDCs. Many of the largest private markets managers have recognized that their next marginal dollar of AUM is from retail investors. Pitchbook estimates that north of $200 billion has been raised in these vehicles over the past couple of years, allowing the overall market to gather AUM, despite less institutional AUM in the space.11 In fact, recent data suggests that the largest endowments, those typically leaders into areas of private markets have less than one percent of their overall portfolios invested in private debt and only two percent of their illiquid investments.12
There is currently an interesting dichotomy in the private debt markets. On one side, all in yields look very attractive given how far base rates have moved in the past 24 months and a lot of signs point to better lender protections than have been available in recent years. On the other side, there is a growing retail presence in an illiquid asset class (despite the apparent liquidity of some investment vehicles) which is almost entirely floating rate as it appears the probability of fed rate cuts is higher than further rate increases.
Venture Capital
Given the importance of venture capital in the private equity ecosystem and the volatility it has seen over the past couple of years, we decided the topic was deserving of its own section. Our views on venture have remained consistent over the past several years and can be boiled down to a few key considerations: (1) venture hold periods tend to be longer and liquidity is episodic being tightly tied to IPO markets for exits, (2) the best entrepreneurs tend to gravitate toward the proven venture capitalists, (3) early stage rounds tend to provide the best full cycle valuations and (4) although returns can be high, loss ratios also tend to be very high. These factors inform how we think about investment pacing, portfolio construction and GP selection.
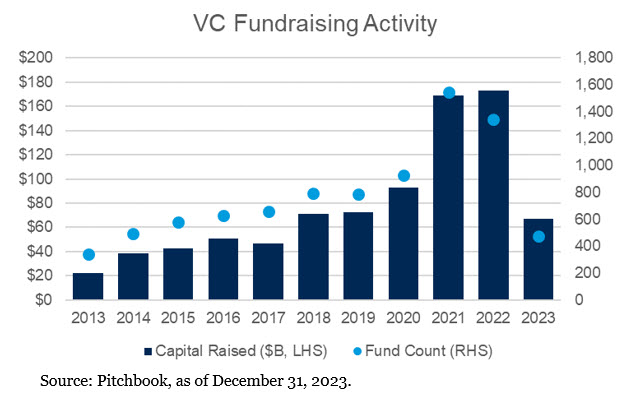
Everyone is generally aware that venture has had a tough 18 months, but the degree of it is probably a bit surprising. Starting with fundraising activity which grew in 2022 given the strong first half of the year it had, fell over 60 percent and the number of funds holding a final close was off almost 65 percent.13 We noted earlier that exits by way of IPO had dwindled significantly and VC is no exception. While the YoY decline in exit value fell just 22 percent, 2023 exit value was 92 percent below that of 2021.13
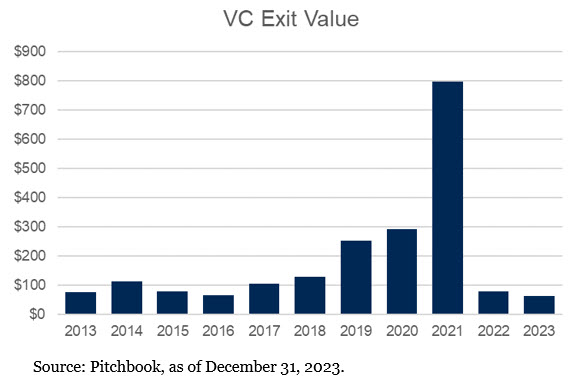
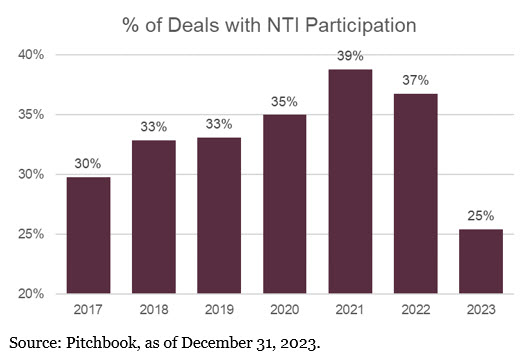
Now, it is worth noting that 2021 was almost 3x the value of the next highest year (2020) aiding to the notion that 2021 was looking more like the anomaly than some sort of deep winter in private markets.14 In that same token, new unicorns in 2023 were at a multi-year low of 45. This is off from 189 in 2022 (recall the strong first half that year) and 344 in 2021.15 Lastly, we want to touch on the non-traditional investor (“NTI”) participation in venture capital deals. Think of these groups as those that aren’t actually venture investors but hypothetically a hedge fund that invested in late-stage venture round hoping to flip those investments to an IPO or a corporation trying to make a few strategic investments. Probably needless to say at this point, but those groups have largely exited the market with the lowest participation in over seven years. We believe at some point these groups will be back and potentially be an indication of sorts in the future.
Like most asset classes, many of these resets are natural and normal course of action – even if comes with a bit of heartburn. Many of the biggest and most revolutionary, or at least impactful, companies are born and/or survive through market downturns. Very few experiences are up and to the right and venture is no exception. While it is been a rockier ride as of late, the asset class is designed for taking risk and the reset will likely lead to brighter days.
Valuations and Leverage
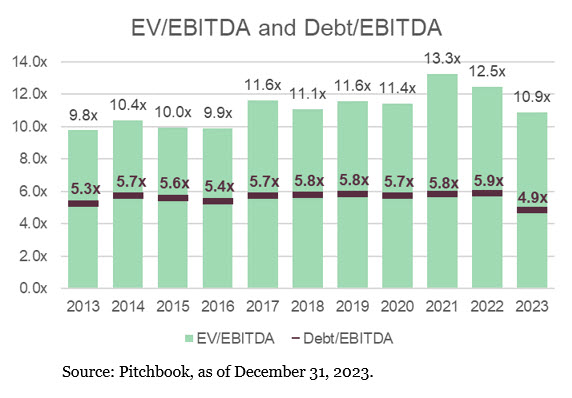
Like fundraising, deal activity and exits… median valuations and leverage levels also came down in 2023. As shown in the graph, median US buyout multiples fell to 10.9x in 2023 from 12.5x in 2022 and a peak of 13.3x in 2021. This coincided with a full turn decline in leverage (which also accounts for the bulk of the decline in valuation) from 5.9x to 4.9x, also highlighted below. The decline in leverage is likely two-fold, but primarily driven by the fact that companies are forced to maintain less leverage given the cost of it is much higher than in the past. It is clear, and maybe always was, that the wide bid/ask spread that stalled out many deals in the second half of 2022 likely resulted in lower valuations in 2023.
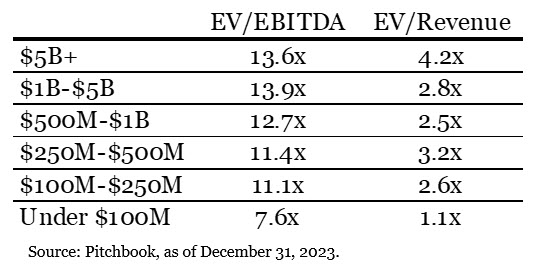
The data under the hood is always just as interesting as the headline levels. Breaking down the valuations by size yields exactly what everyone should expect – smaller deals are trading at lower multiples. The thing likely missed in the raw numbers is that $100 million companies do not turn into $1 billion companies overnight. That requires strong operating capabilities to grow and potentially transform the business, but when that happens the added benefit of multiple expansion boosts returns.
As we continually test our thesis within certain areas of private markets, we view this data as both informative and supportive. It becomes more powerful when viewed in conjunction with the live market context and feedback from a wide variety of market participants. In many instances there’s no way to outright avoid, but we can insulate. For example, how do we make our private equity portfolio less sensitive to interest rates? We target funds and GPs that utilize less leverage. How do we seek to add value on entry? Invest in a part of the market that structurally trades at lower multiples. Is there a way to make returns more repeatable and sustainable? Partner with groups that aren’t just great at sourcing, but also great at operating and growing companies. Many of these questions, or substantially similar ones, are on a constant replay loop to ensure we think about not just how markets have been historically but also what factors will likely impact it in the future.
In Closing
For a “quiet” year, there was a lot to go through and, as it always seems, an interesting point in time in the market. If nothing else, it is hopefully apparent that there is little uniformity in private markets and the nuances exist everywhere. But that is also what creates dispersion and difficulty, and therefore we believe creates the opportunity to outperform over time. In many markets, owning the ‘beta’ is sufficient and, frankly, recommended, but owning beta in private markets is quite expensive and as a result we think, probably more than ever, the story over the next decade will be about ‘what you owned’ rather than ‘if you owned’.
To discover the potential of private markets and start strategically building out your portfolio today, kindly contact our experts at Fiducient Advisors for further details.
1Pitchbook 1H 2023 Private Debt Report
2Fiducient Advisors internally tracked data | Last year = 1/1/2023 – 12/31/2023
3Pitchbook 2023 Q3 Global Fundraising Report
4Pitchbook as of September 30, 2023.
5, 6, 7, 8Pitchbook 2023 US PE Report as of December 31, 2023
9Pitchbook Global Fundraising Report, Q3 2023
10Trepp, Inc., December 31, 2023
11Pitchbook 1H 2023 Private Debt Report
122023 NACUBO Study of Endowments; Largest segment is $5B+
13, 14, 15Pitchbook NVCA Venture Monitor as of December 31, 2023
Material Risk Disclosures
Private Equity involves higher risk and is suitable only for sophisticated investors. Along with traditional equity market risks, private equity investments are also subject to higher fees, lower liquidity and the potential for leverage that may amplify volatility and/or the potential loss of capital.
Private Real Estate involves higher risk and is suitable only for sophisticated investors. Real estate assets can be volatile and may include unique risks to the asset class like leverage and/or industry, sector or geographical concentration. Declines in real estate value may take place for a number of reasons including, but not limited to economic conditions, change in condition of the underlying property or defaults by the borrower.
The information contained herein is confidential and the dissemination or distribution to any other person without the prior approval of Fiducient Advisors is strictly prohibited. Information has been obtained from sources believed to be reliable, though not independently verified. Any forecasts are hypothetical and represent future expectations and not actual return volatilities and correlations will differ from forecasts. This report does not represent a specific investment recommendation. The opinions and analysis expressed herein are based on Fiducient Advisor research and professional experience and are expressed as of the date of this report. Please consult with your advisor, attorney and accountant, as appropriate, regarding specific advice. Past performance does not indicate future performance and there is risk of loss.