
Key Observations
• Q2 2021 registered the second-highest quarterly Private Equity deal activity in a decade.
• Overall exit value for Private Equity deals in H1 2021 exceeded the value recorded for all 2019.
• Direct lending raised more capital as interest rates remained low and investors moved past distressed opportunities.
• The number of funds raising capital in the market continued to increase.
Private Equity
As vaccines became available to more people across the globe, most countries, including the U.S., started a return to normalcy. This was evident in droves of economics data, including:
• Inflation numbers, which rose significantly
• Decline in jobless claims, which fell to their lowest levels since before the pandemic
It was also evident in everyone’s daily lives as air traffic returned and employers introduced new “return-to-office” policies. The recovery was reflected in the performance of both public and private markets as investors maintained a risk-on mentality.
The private equity (“PE”) industry is on track to have a record-setting year driven by two main factors:
• Pent-up demand
• The tax policy environment
According to Pitchbook, Private Equity firms closed 3,708 deals worth a combined $456.6 billion during the first six months. Deal activity in Q2 2021 was also the second-highest recorded in a decade. At current pace, we will likely surpass all 2020 deal value at some point in the third quarter.1
Dealmaking in the IT industry remained strong in Q2 2021 as it made up for 25 percent of the overall value.1 Mainly driven by growing needs of digitization after a year of lockdown, the software industry featured some significant deals, such as Thoma Bravo’s move to take Proofpoint private at a valuation of around $12.3 billion, making it the largest deal in the history of cybersecurity. The prevalence of larger funds competing for large deals has driven multiples higher in recent quarters and years, particularly in the robust software market.
The fundraising environment was similarly robust as slightly more than $600 billion was raised in private markets globally during the first half of 2021.1Within North American buyout, Pitchbook reported 207 funds raised just shy of $200 billion during H1 2021 as institutional allocations to the asset class increased. Further aiding the capital raise was the return of in-person diligence, which allowed for Limited Partners (LPs) to explore new managers rather than relying on re-ups with more familiar General Partners (GPs). H1 2021 also saw closing of 26 first-time funds compared to that of 46 first-time funds during the whole of 2020. Given the numbers registered during the first half of the year, market expectations are encouraging as 2021 is off to being a stellar year for PE.
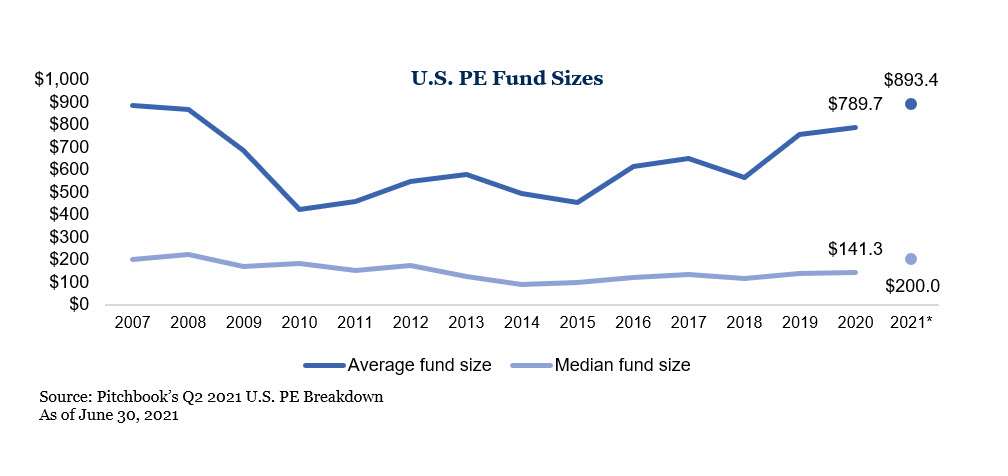
While median deal size has remained relatively unchanged, average fund size continues to increase with the ever-growing mega funds. According to Bain & Company, a little more than half of buyout capital raised over the past six months was from nine funds.2 The continued increase in fund size puts greater pressure for deployment of capital into larger deals, thereby creating increased competition into fewer opportunities of size. Comparatively, middle-market deal activity accounted for 64.8 percent of the total number of deals.
Managers took advantage of the low interest rate environment to finance Leveraged Buyouts (LBOs) transactions and dividend recapitalizations as investors anticipate an interest rate hike by the Fed in 2023. With regards to valuations, buyout multiples increased slightly from 2020 but still are below peak multiples in 2019. As of June 30, 2021, the median Debt/EBITDA multiple for buyout acquisitions was 7.0x whereas the median buyout EV/EBITDA multiple was 13.1x.
Also significant is the exit activity that has occurred during the first half of 2021, which has already seen 676 PE exits valued at $355.9 billion, surpassing the annual exit value for 2019.1 The number of exit avenues continues to grow for many private equity funds as there are larger and more funds up market, strategic buyers flush with cash, as well as opportunities through public markets with a traditional IPO, direct listing or to a SPAC. Notably, Healthcare and Technology companies found great exit opportunities through both traditional IPOs and acquisitions by SPACs.
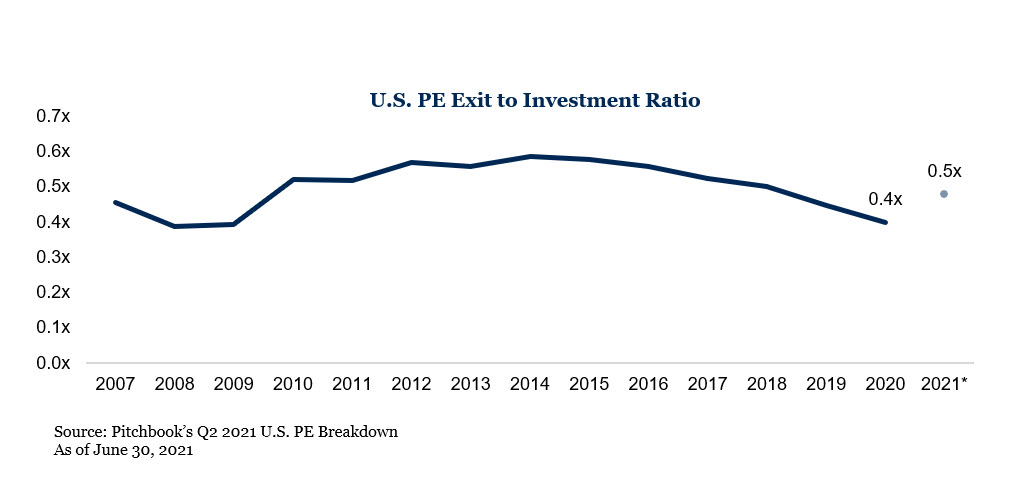
Even though exit activity remains robust, the number of investments during the period is almost double the number of exits. In the first half of the year, U.S. PE firms made 1,035 investments compared to 496 exits, highlighting the growth and prominence of the asset class.
Private Debt
As expected, the Private Debt industry has faced its share of challenges over the last five quarters. While many funds reported their worst performance in nearly a decade at the outset of the pandemic, defaults remained low, and portfolio companies started to recover alongside the economy. Even so, low interest rates have continued to attract investors to the space as they look for yield outside of traditional fixed income.
According to Pitchbook, managers within the Private Debt space have raised $72.5 billion across 81 funds in the first six months of 2021.2 This is on pace with 2020 and the previous five-year average. Within Private Debt, some strategies have been more popular than others. Direct Lending continues to be favored, raising the most capital at $33.5 billion as well as managers in Europe, who drew in $22 billion during the period. Limited Partners continue to seek out opportunities in regions outside the U.S., as evidenced by Ares Capital Europe Fund V, which was the largest private debt fund to close this year at approximately $13 billion. Other areas, such as Distressed Debt and Special Situations, continued to raise capital at a similar rate to 2020, but enthusiasm around the strategies has dwindled as the economic recovery happened at a rapid pace. Unlike previous crises, the market has not witnessed a vast number of bankruptcies or distress, leaving many to wonder how the capital raised will be put to work.
In fact, default rates for small companies and middle market loans continued to decline. The Proskauer Private Credit Default Index indicates that the default rate for companies with at least $50 million in EBITDA fell from 5.3 percent in Q2 2020 to just one percent in Q1 2021.
Private Real Estate3
It is no surprise that Real Estate too was not immune to the harsh consequences of the pandemic as fundraising numbers continued to be in the lower ranges seen in the last five years. Pitchbook reported that 59 funds that closed during Q2 2021 raised an aggregate of $19 billion, most of it in the value-add strategy. However, the second quarter of the year saw the number of deals within the hotels industry proliferate by 253 percent year-on-year (YoY) as travel rebounded. In addition, in the retail sector, there was an increase by 117 percent YoY as stores opened after hopes of reduced contraction due to vaccines. Further, a drop in valuations in the prior period attracted investors to the space.
As a result of lesser fund closings during the period, the number of funds in the market again reached an all-time high where 1,240 funds looked to raise an all-time high aggregate capital amount of $360 billion.
In conclusion, as the global economy continues to rebound from the effects of the COVID-19 pandemic, activity in the private markets maintains robust growth and is on a path to surpass continued all-time high numbers.
For more information, please contact any of the professionals at Fiducient Advisors.
1Bain & Company: Bain PE Brief – First Half Wild Ride
2Pitchbook H1 Global Private Debt Report
3Data under this section is sourced from Preqin Quarterly Update: Private Real Estate Q2 2021 Tearsheet
The information contained herein is confidential and the dissemination or distribution to any other person without the prior approval of Fiducient Advisors is strictly prohibited. Information has been obtained from sources believed to be reliable, though not independently verified. Any forecasts are hypothetical and represent future expectations and not actual return volatilities and correlations will differ from forecasts. This report does not represent a specific investment recommendation. The opinions and analysis expressed herein are based on Fiducient Advisor research and professional experience and are expressed as of the date of this report. Please consult with your advisor, attorney and accountant, as appropriate, regarding specific advice. Past performance does not indicate future performance and there is risk of loss.