Key Observations
• U.S. dollar strengthened in September as the effects of existing monetary stimulus wane and expectations for fiscal stimulus before the election fade.
• Market participants bid up financial asset risk premia in response to mounting economic and political risks.
• We encourage investors to keep their investment horizon in focus and not allow emotions to influence portfolio positioning.
Market Recap
Three themes ended the global rebound in risk assets. First, U.S. dollar weakness beginning late March reversed course and strengthened 1.9 percent in September. In our view, U.S. dollar strength signaled that effects of monetary stimulus began to wane. Second, expectations for another round of fiscal stimulus appeared to fade quickly in September which lead to increased equity market volatility. Finally, the sluggish recovery in jobs and announcements of additional job cuts indicated structural damage to the labor market.
Rising volatility in U.S. stocks modestly benefited U.S. Treasury bonds relative to spread sectors, but not enough to keep Core U.S. Bonds in positive territory. The Bloomberg Barclays U.S. Aggregate Bond Index fell 0.1 percent in September. U.S. High Yield spreads widened 40 basis points during the month and pulled the sector down 1 percent. Intermediate-term U.S. inflation expectations fell 17 basis points while nominal rates held steady, which caused U.S. TIPS to close out the month 0.4 percent lower. Despite U.S. dollar weakness, market participants did not find solace in foreign bonds1, which ended the month unchanged, while Emerging Market Debt fell 2 percent.
Similar to the way in which the rebound in technology stocks spread to global risk assets last March, volatility in that sector emerged in late August and spread to global risk assets in September. The Nasdaq Index fell 5.1 percent during the month inclusive of a month end rally that masked the intramonth index correction from September 2 to September 23.
With five stocks (Apple, Microsoft, Amazon, Alphabet and Facebook) making up over 22 percent of the S&P 500 Index (-3.8 percent in September), these leaders bear monitoring. U.S. Small Cap stocks (Russell 2000 Index, -3.3 percent) slightly outperformed their larger counterparts (Russell 1000 Index, -3.6 percent) for the month on a relative basis and International Developed (ex-U.S.) and Emerging Market returned -2.6 percent and -1.6 percent, respectively. While relatively higher returns from international equities are encouraging, we acknowledge that international equity indices have less exposure to technology sector stocks. Time will tell if a secular shift is afoot.
Within real assets, REITs fell 3.3 percent in September after reopening risks and cooler temperatures weighed on retail and office-related sector sentiment. Midstream Energy fell 13.6 percent in September on heightened concerns that increased U.S. crude oil production volumes may exceed demand in the fourth quarter. The aforementioned U.S. dollar strength broadly weighed the Bloomberg Commodity Index, which fell 3.4 percent.
Election Complexion
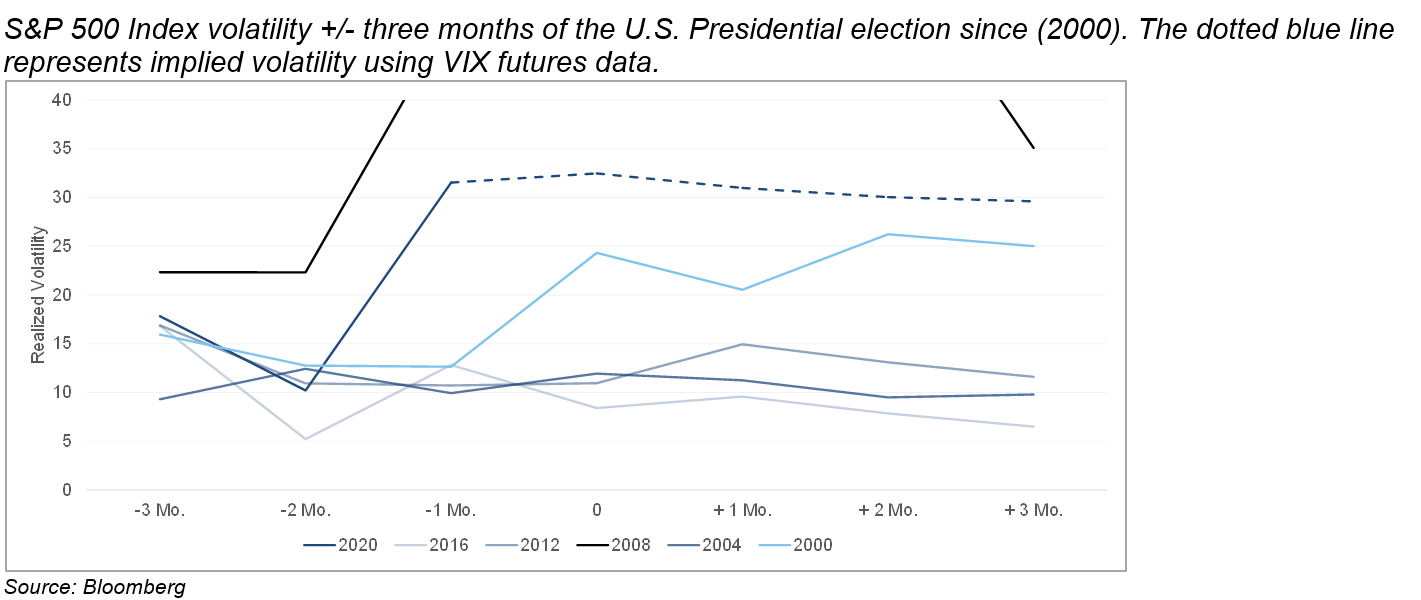
Bipartisan support for a fresh round of fiscal stimulus gave way to political gridlock in September and doused investor optimism for a deal before election day on November 3. Amid an already unstable economic backdrop, financial markets had to factor political uncertainty into risk premia. As shown in the chart below, realized volatility leading up to this year’s election is higher than recent elections, except the 2008 election which coincided with the Global Financial Crisis. Furthermore, CBOE VIX futures, a measure of 30-day implied volatility on the S&P 500 Index, illustrates that implied volatility is expected to remain elevated following this year’s election (represented by the dotted line in the chart below).
Before & After
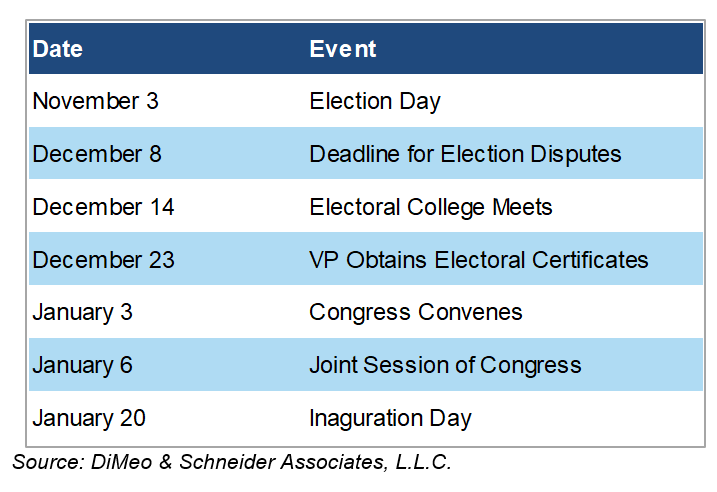
Heightened equity risk premiums (implied volatility) suggest that investors have priced in the possibility that neither party concede a close presidential race. While that may be true, it is not certain. Nevertheless, present volatility conditions serve as a reminder to adhere to a disciplined investment process and resist the temptation to deviate from a thoughtful strategic allocation framework. For our part, we will keep an eye on the key dates shown in the table below.
Market Outlook
As if an unclear economic growth outlook, timing and amount of fiscal stimulus for households and businesses and political concerns were not enough, corporations will release third quarter earnings in the coming weeks. With an abundance of macroeconomic and political risks fraying investor resolve, we advocate for maintaining the established strategic asset allocation rooted in long-term fundamentals. We encourage investors to keep their investment horizon in focus and to not allow emotions to influence portfolio positioning.
For more information, please contact any of the professionals at Fiducient Advisors.
1Foreign bonds returns were 0.0 percent and reflect the equal weight return on the Bloomberg Barclays Global Aggregate ex-U.S. Hedged and Bloomberg Barclays Global Aggregate ex-U.S. Unhedged.
The information contained herein is confidential and the dissemination or distribution to any other person without the prior approval of Fiducient Advisors is strictly prohibited. Information has been obtained from sources believed to be reliable, though not independently verified. Any forecasts are hypothetical and represent future expectations and not actual return volatilities and correlations will differ from forecasts. This report does not represent a specific investment recommendation. The opinions and analysis expressed herein are based on Fiducient Advisor research and professional experience and are expressed as of the date of this report. Please consult with your advisor, attorney and accountant, as appropriate, regarding specific advice. Past performance does not indicate future performance and there is risk of loss.