Effective endowment fund management requires regularly analyzing comparative results – the key is identifying appropriate methods and tools to interpret good vs. bad outcomes.
Measuring Portfolio Growth vs. Personal Growth
The adage: “You don’t need to be perfect; you just need to be better than you were yesterday” is good advice for personal growth but has less application when evaluating investment results. In today’s volatile up/down market, outperforming yesterday might not be enough, nor does it represent an appropriate timeframe for comparison.
Managing investments is never about being “perfect” either; understanding your portfolio’s effectiveness requires quantitative and qualitative data points to make the relevant comparisons and is best when examined regularly with attention to intermediate and longer-term periods. Applying the right framework for benchmarking remains crucial for nonprofit organizations and can include elements beyond traditional portfolio results and statistics. Taking a holistic view can help adequately assess performance (risk and return), identify best practices and ensure financial sustainability.
Measuring What Matters
Most nonprofit investors regularly draw (spend) from their portfolios in a manner that helps support (fund) their budget operations and mission. For private foundations, the target “spend” rate is typically a minimum of 5% per year to comply with IRS rules for maintaining non-taxable status. Public charities may have more leeway when establishing target draw rates, but the range is often between 4-5%. [You can read more about our thoughts on spending methods here].
When pairing a target draw rate of 4-5% with preserving the portfolio’s purchasing power (i.e., annual inflation adjustment), the portfolio’s required annualized growth rate equates to roughly ~7%+ per annum in nominal terms (“5% + ~2% +/- historical inflation”). This might have seemed to be a relatively easy feat in the years 2023 and 2024 when markets generally moved steadily higher. However, generating +7% over full market cycles (7-10 years) may prove more challenging looking forward.
We recommend nonprofit investors focus on the long-term and remain mindful of end-point sensitivity when considering a portfolio’s historical results. As you will note from our insights on the “Active vs. Passive Debate,” no fund strategy or fund manager is immune to underperformance – even index funds can underperform passive indices after fees/costs. Nonprofit endowment portfolios are no exception. The “spend + inflation” objective is one that your portfolio will hopefully achieve consistently, though it is unlikely to do so in every period over every timeframe. Try to remain realistic and pragmatic when looking at quarterly results and comparing annualized returns. When a portfolio’s 10-year return falls well below its target spend rate + inflation, seek to understand why. The further away an endowment portfolio moves from its “spend + inflation” target return, the more challenging it will become to support its charitable mission over the long term. One of the first and best places to understand the drivers of return is to examine the portfolio’s asset allocation.
1 – Measuring Your Portfolio Mix: Fiducient Advisors’ investment philosophy is predicated on the belief that strategic asset allocation represents the biggest driver of a portfolio’s long-term returns. It also has the biggest influence on your portfolio’s risk (volatility). Devising the appropriate asset allocation is one of the most important portfolio decisions an investor makes (and continues to make) over time.
In constructing long-term investment strategies for endowments, we take a deliberate approach to helping clients develop a durable and prudently diversified asset mix – and advocate for regularly reviewing and affirming its structure.
Whether your portfolio asset “mix” is represented by 70%/30% equity/bond split or some other proportionate blend of asset classes and includes other sub-allocations (e.g., U.S., Non-U.S. Equity), choose market benchmarks that represent these exposures for each component and compare your portfolio’s performance with the blended (“portfolio benchmark”) returns.
Regardless of whether a portfolio outperforms its blended benchmark, nonprofit investors should review the portfolio’s asset allocation (at least) annually and affirm the expected return and market risk associated with holding this mix align with the portfolio’s risk/return goals.
2 – Measuring Your Portfolio Managers: After reviewing the portfolio’s asset allocation and top-line performance, it is important to assess underlying manager/fund strategy performance. In particular, compare individual managers/funds with each strategy’s respective benchmark. Don’t compare a U.S. large cap manager with an international benchmark – use the appropriate broad-based regional and market cap-specific benchmark – or include the style-based index if the manager employs a growth or value approach.
Beyond index relative performance, consider also how each strategy (manager/fund) has performed relative to peers. Again, even the most compelling managers are subject to periods of underperformance relative to passive indices and/or among universe rankings. Fiducient Advisors periodically publishes “Active vs. Passive” research, which highlights how funds perform in various market segments and why that might aid the decision of when/where to choose active vs. passive management.
3 – Measuring Your Portfolio Peers: The typical third act of the holistic benchmarking process takes into account how a portfolio compares to peers. There are numerous annual studies available in today’s market focusing on the traditional components of endowment management (e.g., asset allocation, returns, spending trends). Each survey routinely focuses on a specific nonprofit sector (e.g., higher education institutions). Data is collected from the population, aggregated and analyzed. The output is then often poured over by those institutions whose sector is represented in the study.
There are often a few tidbits that can be gleaned from these annual reviews – usually related to near-term trends. However, like any survey, there can be flaws in the data (either in its source or display), so take caution in extrapolating too much.
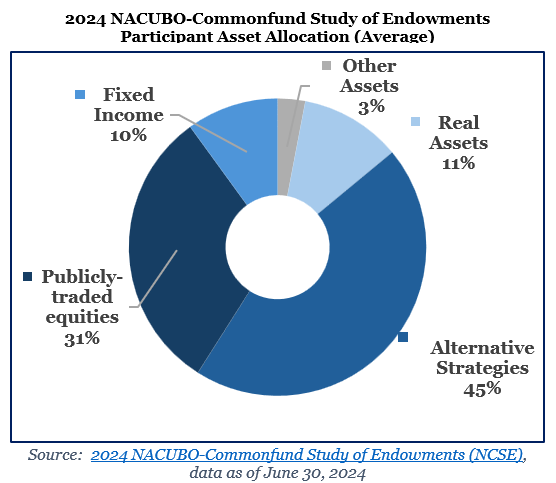
The NACUBO Annual Study of Endowments is one of longest-running “peer” surveys available and provides insights on the endowment management trends among higher education institutions (colleges, universities and other sponsoring foundations). The pie chart above displays the average asset allocation across the portfolios of the survey respondents as of June 2024. For a board or investment committee overseeing a college endowment fund, this asset allocation might be interesting to reference but should have little bearing on how the board/committee and their investment advisor ultimately design the school’s asset allocation.
Bonus Measurement: More recently, in addition to asking for traditional portfolio statistics and spending/budget trends, these surveys have asked to what degree responding institutions are outsourcing the management of their endowment funds and choosing Outsourced Chief Investment Officer (“OCIO”) services. Before outsourcing management of endowment funds, it is important to understand The Key Considerations for Investment Oversight of Endowments and Foundations. While there appears to be a move towards outsourcing, there are currently few conforming ways in which OCIO firms can be readily benchmarked against each other or comparable market metrics. Third-party firms, consultants and the CFA Institute have begun efforts to help standardize the methods for benchmarking OCIO services. In late 2024, the CFA Institute provided a guidance statement for conforming to the proposed standards of OCIO performance benchmarking.1 To continue growing, the evolution of OCIO will certainly need to adhere to the critical aspects of intelligent benchmarking that include relevancy, transparency and consistency.
“You can’t improve upon what you don’t measure” is a quote attributed to Peter Drucker. Its meaning has broad application and can certainly pertain to endowment management – as well as personal growth. Nonprofit investors should consider the elements of benchmarking outlined above and see where their next measurements take them.
For more information on any of the topics discussed here, please contact any of the professionals at Fiducient Advisors.
1CFA Institute Guidance Statement for OCIO Portfolios (Dec-24).pdf
The information contained herein is confidential and the dissemination or distribution to any other person without the prior approval of Fiducient Advisors is strictly prohibited. Information has been obtained from sources believed to be reliable, though not independently verified. Any forecasts are hypothetical and represent future expectations and not actual return volatilities and correlations will differ from forecasts. This report does not represent a specific investment recommendation. The opinions and analysis expressed herein are based on Fiducient Advisor research and professional experience and are expressed as of the date of this report. Please consult with your advisor, attorney and accountant, as appropriate, regarding specific advice. Past performance does not indicate future performance and there is risk of loss.