
• Since the mid-1990’s, the superior risk-adjusted returns investors once received from regionally diverse equity allocations has faded as domestic stocks have outperformed developed international markets and correlations have risen between each region.
• Before 2009, U.S. and developed international market stocks saw similar periods of outperformance with U.S. leadership coinciding with the strength of the dollar.
• With international stocks trading at a significant discount to U.S. equities and the dollar bull market reaching the length in time, which marks a reversal historically, we believe the probability of international stocks returning to favor is increasing.
• An allocation to developed international market stocks provides access to a majority of the world’s most profitable businesses, attractive opportunities for active managers and greater sector diversification.
The father of Modern Portfolio Theory, Harry Markowitz, called diversification “the only free lunch in finance,” based on his finding that pairing assets with imperfect correlations improves risk-adjusted performance. Unfortunately, the “free lunch” for domestic investors broadening their equity allocations to include developed non-U.S. market stocks has not materialized in recent years as globally diversified equity allocations reduced returns and increased risk relative to U.S. equity allocations.
Historical Perspective – Risk, Return and Correlation
Throughout much of the history of U.S.1 and international developed market stocks2 , pairing the two assets produced better risk-adjusted returns relative to a dedicated allocation to either region. Starting in 1975 through the mid-1990’s, investors realized similar cumulative gains from U.S. and non-U.S. developed market stocks. Additionally, an equally weighted mix of the two markets saw less volatility relative to a stand-alone domestic allocation, illustrated in the chart below.
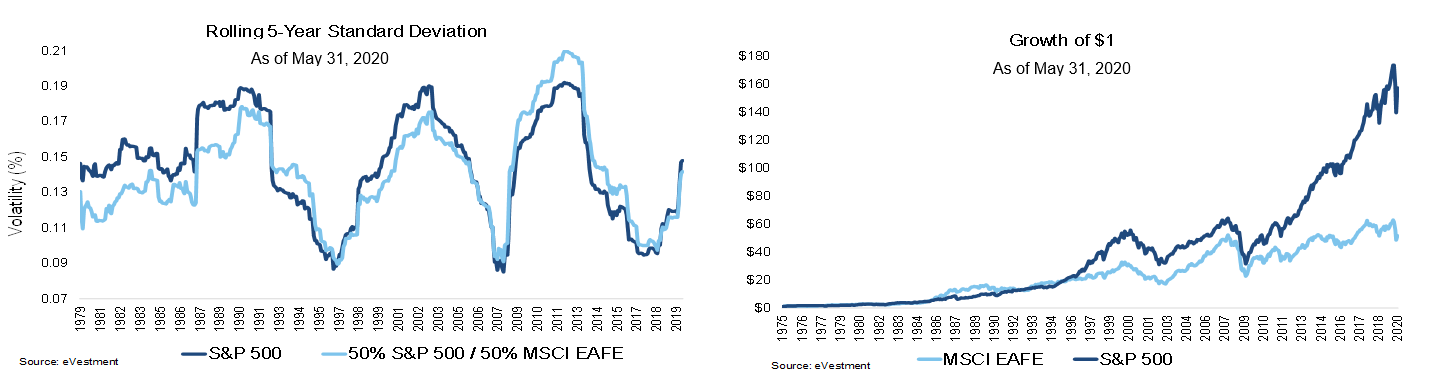
More recently, U.S. stocks have outperformed their international peers. As previously illustrated, cumulative gains among markets diverged following the period of relative outperformance by U.S. equities in the 1990’s and the 424 percent total return domestic equities saw since the market bottom in March 2009 through May 2020; a 285 percent greater total return than developed international markets produced. Since the 1990’s, the performance dispersion between U.S. and developed international stocks has been so large that while a $1 invested in 1975 grew in both markets to $18 by June 1995, it’s risen to $165 and $54, for U.S. and international developed stocks, respectively, as of May 2020.
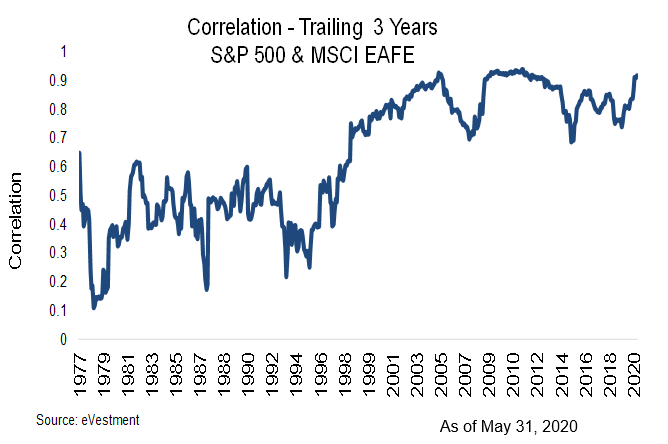 The diversification benefits of allocating to non-U.S. developed market stocks too has faded. The correlation between U.S. and international developed equities averaged 0.43 from 1975 through 1997 but rose dramatically to 0.83 from 1998 through May 2020. As the correlations increased, the addition of non-U.S. developed market stocks to portfolios with domestic equities no longer reduced risk as much as it did through 1997. In fact, since 1997 through May 2020, the average three-year standard deviation of an equally weighted mix of U.S. and international developed market stocks saw 0.15 percentage points more volatility than the S&P 500, compared to reducing volatility by 1.84 percentage points from 1975 through 1997.
The Cyclicality of U.S. and International Markets
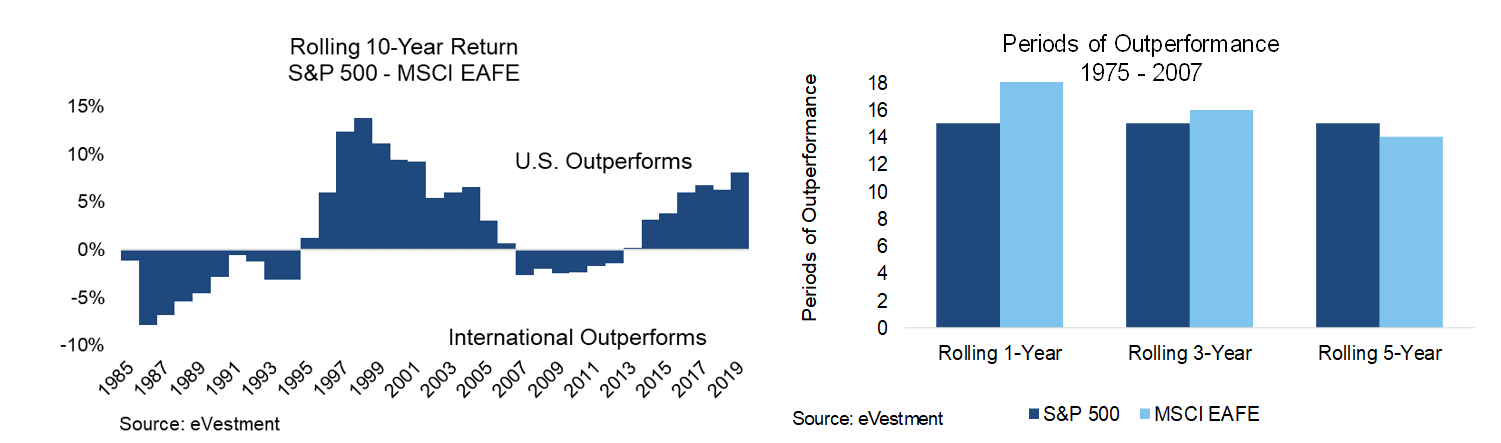
Historically, patterns suggest investors should not abandon their non-U.S. developed market allocation. Domestic stocks have outperformed in nine of the past 12 years. However, in the 33 years prior, the total returns of international developed market equities exceeded that of U.S. stocks in 18 years and outperformed almost half-the-time when observing rolling three-, five-, and ten-year periods; as shown on the next page.
Periods of dominance from one market have been prolonged yet cyclical, with rolling ten-year returns showing international developed stocks outperformed from 1985 through 1995 and 2007 through 2013. We believe this exchange between markets signals international equities are due to return to favor after an extended period of strength by U.S. stocks since the financial crisis.
The Dollar’s Impact
The relationship between the U.S. dollar and regional equity market performance is also cyclical.
Going back to 1973, examining an index of the trade-weighted dollar, we found periods of “dollar strength,” defined as intervals ranging from the dollar’s trough to its peak, and periods of “dollar weakness” using the inverse measurement. Dollar strength is equivalent to foreign currency weakness, which poses strong headwinds on the returns of assets denominated in foreign currencies when translated into U.S. dollars. For example, if a Japanese stock rises 10 percent, but the U.S. dollar strengthens 12 percent against the yen, the net return to a dollar-based investor is a negative 2 percent.
There was a clear relationship between periods of U.S. equity market outperformance and a strengthening U.S. dollar. In the three-dollar bull markets since 1973, U.S. equities have an average excess return of 120 percent over international developed markets, compared to a negative 89 percent average excess return during periods of dollar weakness.
Without forecasting the end to the current period of dollar appreciation that began in August 2011, we found this strengthening cycle reached 101 months at the end 2019 – slightly longer than the 99 month average length of dollar bull or bear markets. As this period of dollar appreciation grows long in the tooth, we believe U.S. equities could be at risk of losing a tailwind.
1Defined as the S&P 500 Index.
2Defined as the MSCI EAFE Index.
The information contained herein is confidential and the dissemination or distribution to any other person without the prior approval of Fiducient Advisors is strictly prohibited. Information has been obtained from sources believed to be reliable, though not independently verified. Any forecasts are hypothetical and represent future expectations and not actual return volatilities and correlations will differ from forecasts. This report does not represent a specific investment recommendation. The opinions and analysis expressed herein are based on Fiducient Advisor research and professional experience and are expressed as of the date of this report. Please consult with your advisor, attorney and accountant, as appropriate, regarding specific advice. Past performance does not indicate future performance and there is risk of loss.