Strong global equity markets in February were shrouded by escalating tension in the Middle East
Key Observations
• Global equity markets were positive as cooling inflation hopes clashed with mixed Fed signals and rising geopolitical risk. International equities delivered strong gains, benefiting from the demand for AI related hardware, while U.S. large cap equities slipped on continued concern from AI software disruption.
• The U.S. Supreme Court struck down the broad tariffs the President imposed under IEEPA. Policy uncertainty remains and the initial market impact was somewhat muted on the announcement.
• Tensions escalated in the Middle East, culminating with a coordinated military strike on Iran by the U.S. and Israel on the last day of the month. The humanitarian and geopolitical impact overshadows the immediate near-term market impact.
Market Recap
February delivered a mix of optimism and unease, as investors grappled with a host of developments throughout the month. Early on, markets took comfort from signs that inflation was cooling as the January CPI report (released in February) came in lower than expected. That helped keep the conversation alive around eventual rate cuts, even as Federal Reserve communications indicated mixed views on the future path of interest rates. Later in the month the U.S. Supreme Court ruled the International Emergency Economic Powers Act (IEEPA) does not authorize the President to impose broad based tariffs. Volatility ticked higher and inflation concerns reignited as geopolitical tensions escalated in the Middle East when the U.S. and Israel mounted a coordinated military strike against Iran on the last day of the month.
Against that backdrop, large-cap U.S. equities finished slightly lower. The S&P 500 Index fell (-0.8%), pressured by continued anxiety around software disruption from AI. Information technology and financials were among the sectors negatively impacted. Sentiment has shifted from the Magnificent 7 to the “HALO” trade (hard-asset, low obsolescence). Investors favored areas of the market perceived to be more insulated and less susceptible to direct disruption from AI. Asset-heavy sectors such as utilities, energy, materials and industrials were top performers.
Small caps held up better, with the Russell 2000 Index producing a slight positive return (+0.80%), a reminder that market leadership broadened beyond mega‑cap growth as investors leaned into more cyclical and value‑oriented areas.
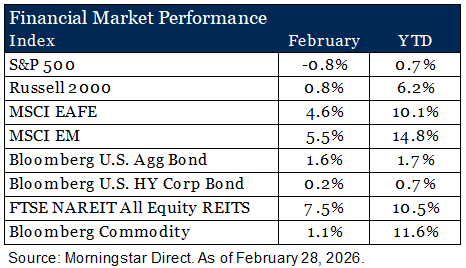
Outside the U.S., returns were notably stronger. International developed stocks (MSCI EAFE) gained 4.6%, while emerging markets (MSCI EM) rose 5.5%. Part of that strength reflected a market narrative that emerging market exposure to the “hardware side” of AI, especially in parts of Asia, looked more durable than stretched U.S. software valuations. Japan was a standout for developed markets as investors viewed the election outcome favorably due to expectations of increased government spending. In Europe, easing inflation pressures and strengthening economic data helped propel markets.
Bond markets offered welcome ballast. Core fixed income (Bloomberg U.S. Aggregate Bond Index) returned 1.6%, supported by a meaningful rally in Treasuries during the month as longer‑term yields moved down. High yield lagged, but still finished modestly positive (+0.2%), as carry remained supportive even with pockets of risk aversion near month‑end. Real assets were a bright spot. REITs surged 7.5%, benefiting from falling long‑end yields and improving sentiment toward rate‑sensitive income sectors. Commodities gained 1.1%, supported by firming inflation expectations at the end of the month as U.S.-Iran tensions grew.
Operation Epic Fury
On February 28, 2026, U.S. and Israeli forces launched coordinated military strikes on Iran (Operation Epic Fury), targeting nuclear facilities, military infrastructure and senior leadership. Iran’s Supreme Leader, Ali Khamenei, was killed, and retaliatory strikes have since begun. The situation remains fluid.
Military action that results in civilian death and displacement is, of course, a grave humanitarian tragedy. We hope for a swift resolution. Turning to our investment remit, the financial market impact of such events often proves far less severe than the human toll, and where material, tends to be concentrated in specific markets and economic sectors. In the Middle East, that nexus is energy production and its transit. Below, we examine the scale of the potential impact and, most importantly, answer the question: how does this affect your portfolio?
Economic Fall Out
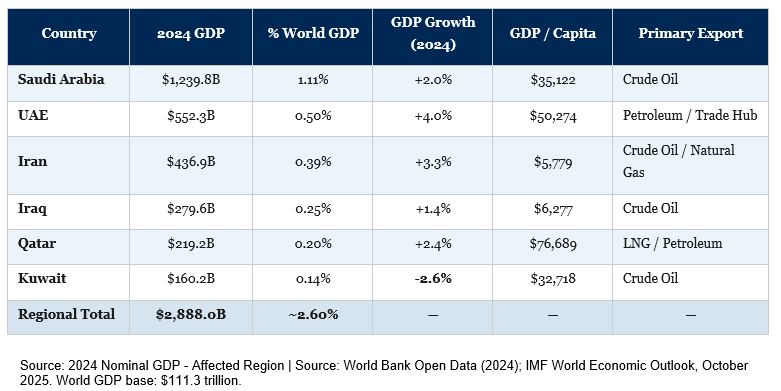
A complete accounting is not yet possible while military action remains kinetic, but we can begin to frame for context. The immediately affected region1 represents approximately 2.6% of global GDP,2 with Iran accounting for approximately 0.4%3 on its own. Importantly, even during active conflict, commerce does not halt entirely. It slows but continues. Assuming a 50% decline in Iran’s GDP and a 10% decline across the broader region, the drag on global GDP would be approximately 0.4%, roughly equivalent to five days of U.S. economic output.4 Significant for those within the region, but not at a scale that alters global economic trajectory.
Collateral Damage
The impact, however, does not stop at regional borders. Energy is the most consequential export at risk. The Middle East accounted for approximately 30% of global oil production and 17% of global natural gas production in 2024.5 Material disruption to these facilities would place upward pressure on headline inflation. The more likely friction point, though, is not at the well or refinery. It is in transit. The Strait of Hormuz, a 21-mile passage, is one of the world’s most critical chokepoints for seaborne energy. In 2024, flows through the Strait accounted for more than one-quarter of total global seaborne oil trade and approximately 20% of global oil and petroleum product consumption.6 Separately, approximately 20% of global liquid natural gas (“LNG”) trade also transited the Strait in 2024, primarily from Qatar.7
That flow, however, is not distributed evenly across the globe. Roughly 84% of crude oil and LNG volumes moving through the Strait are destined for Asia,8 with China, India, Japan and South Korea as the dominant oil importers and, to a lesser extent, Asia also absorbing the bulk of LNG flows. Europe is a secondary recipient of natural gas. The U.S. has limited direct exposure, given its status as a net commodity exporter. Even so, oil is priced globally, and rising prices would affect U.S. producers and consumers alike.
Market Impact
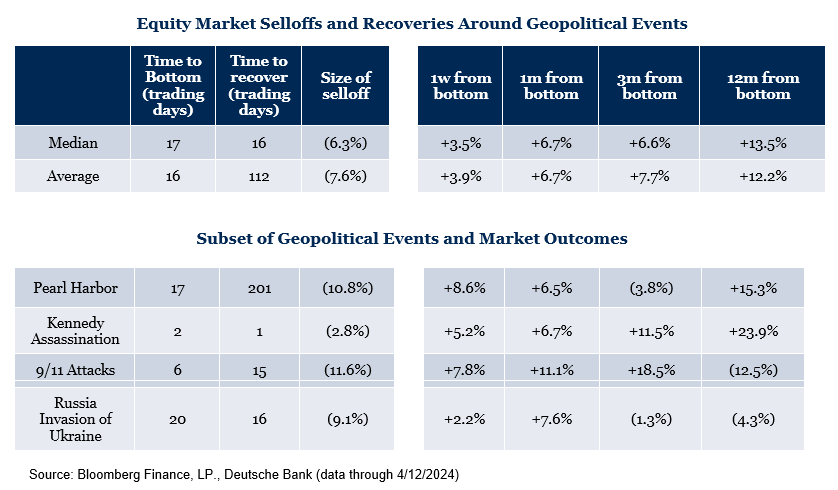
History, unfortunately, offers no shortage of data points on how markets respond to military conflict. The pattern is consistent: when conflict remains regionalized, the market impact tends to be transitory. Initial reactions are typically negative, as uncertainty drives investors toward safe havens such as bonds and the U.S. dollar.
With limited public appetite for a sustained U.S. military engagement in Iran, and the risk that prolonged conflict could lift headline inflation ahead of an affordability-focused midterm election later this year, we expect either resolution or meaningful de-escalation in the near term. The larger puzzle pieces on the board are connecting the events in Iran with developments in Venezuela, pressure on Cuba and Greenland, and the evolving arc of U.S.-China relations. President Trump and Xi are scheduled to meet in a number of weeks to discuss evolving relations.
Given the transitory and regionalized nature we described above, we believe portfolios are well positioned to navigate near-term volatility. We will continue to monitor and should the situation evolve meaningfully we will follow up with the potential impact.
1Region defined as: Saudi Arabia, UAE, Iran, Iraq, Qatar, and Kuwait. Source: World Bank Open Data; IMF World Economic Outlook (October 2025) | data.worldbank.org | As of: 2024.
2Aggregate 2024 nominal GDP of the six-country region totals approximately $2,888B against world nominal GDP of $111.3 trillion, yielding ~2.60%. Note: the original paper cited 2.4%; corrected to 2.60% based on sourced data. Source: World Bank Open Data; IMF World Economic Outlook (October 2025) | data.worldbank.org | As of: 2024.
3Iran 2024 nominal GDP: $436.9 billion = approximately 0.39% of world GDP. Original paper cited 0.3%; corrected. Source: World Bank Open Data — GDP (current US$), Iran | data.worldbank.org | As of: 2024.
4U.S. 2024 nominal GDP: $28.75 trillion. Daily output ~$78.8B. A 0.36% drag on $111.3 trillion global GDP equals ~$401B, approximately five days of U.S. output. Source: World Bank Open Data — GDP United States | data.worldbank.org/country/united-states | As of: 2024.
5Middle East provided approximately 30% of global oil production and 17% of global natural gas production in 2024. Source: IEA, World Energy Investment 2025, Middle East | iea.org/reports/world-energy-investment-2025/middle-east | As of: 2025.
6In 2024, oil flow through the Strait averaged 20 million barrels per day, more than one-quarter of total global seaborne oil trade and ~20% of global petroleum liquids consumption. Source: U.S. EIA, “Amid regional conflict, the Strait of Hormuz remains critical oil chokepoint” | eia.gov/todayinenergy/detail.php?id=65504 | As of: June 2025.
7In 2024, approximately 20% of global LNG trade transited the Strait, primarily from Qatar (~9.3 Bcf/d) and UAE (~0.7 Bcf/d). Source: U.S. EIA, “About one-fifth of global LNG trade flows through the Strait of Hormuz” | eia.gov/todayinenergy/detail.php?id=65584 | As of: 2025.
8EIA estimates 84% of crude oil/condensate and 83% of LNG transiting the Strait in 2024 destined for Asian markets. China, India, Japan, and South Korea were the top crude oil destinations. Source: U.S. EIA Strait of Hormuz analyses | eia.gov/todayinenergy/detail.php?id=65504 and eia.gov/todayinenergy/detail.php?id=65584 | As of: June 2025.
Disclosures & Definitions
Comparisons to any indices referenced herein are for illustrative purposes only and are not meant to imply that actual returns or volatility will be similar to the indices. Indices cannot be invested in directly. Unmanaged index returns assume reinvestment of any and all distributions and do not reflect our fees or expenses. Market returns shown in text are as of the publish date and source from Morningstar or FactSet unless otherwise listed.
- The S&P 500 is a capitalization-weighted index designed to measure performance of the broad domestic economy through changes in the aggregate market value of 500 stocks representing all major industries.
- Russell 2000 consists of the 2,000 smallest U.S. companies in the Russell 3000 index.
- MSCI EAFE is an equity index which captures large and mid-cap representation across Developed Markets countries around the world, excluding the U.S. and Canada. The index covers approximately 85% of the free float-adjusted market capitalization in each country.
- MSCI Emerging Markets captures large and mid-cap representation across Emerging Markets countries. The index covers approximately 85% of the free-float adjusted market capitalization in each country.
- Bloomberg U.S. Aggregate Index covers the U.S. investment grade fixed rate bond market, with index components for government and corporate securities, mortgage pass-through securities, and asset-backed securities.
- Bloomberg U.S. Corporate High Yield Index covers the universe of fixed rate, non-investment grade debt. Eurobonds and debt issues from countries designated as emerging markets (sovereign rating of Baa1/BBB+/BBB+ and below using the middle of Moody’s, S&P, and Fitch) are excluded, but Canadian and global bonds (SEC registered) of issuers in non-EMG countries are included.
- FTSE NAREIT Equity REITs Index contains all Equity REITs not designed as Timber REITs or Infrastructure REITs.
- Bloomberg Commodity Index is calculated on an excess return basis and reflects commodity futures price movements. The index rebalances annually weighted 2/3 by trading volume and 1/3 by world production and weight-caps are applied at the commodity, sector and group level for diversification.
Material Risks
- Fixed Income securities are subject to interest rate risks, the risk of default and liquidity risk. U.S. investors exposed to non-U.S. fixed income may also be subject to currency risk and fluctuations.
- Cash may be subject to the loss of principal and over longer periods of time may lose purchasing power due to inflation.
- Domestic Equity can be volatile. The rise or fall in prices take place for a number of reasons including, but not limited to changes to underlying company conditions, sector or industry factors, or other macro events. These may happen quickly and unpredictably.
- International Equity can be volatile. The rise or fall in prices take place for a number of reasons including, but not limited to changes to underlying company conditions, sector or industry impacts, or other macro events. These may happen quickly and unpredictably. International equity allocations may also be impacted by currency and/or country specific risks which may result in lower liquidity in some markets.
- Real Assets can be volatile and may include asset segments that may have greater volatility than investment in traditional equity securities. Such volatility could be influenced by a myriad of factors including, but not limited to overall market volatility, changes in interest rates, political and regulatory developments, or other exogenous events like weather or natural disaster.
- Private Real Estate involves higher risk and is suitable only for sophisticated investors. Real estate assets can be volatile and may include unique risks to the asset class like leverage and/or industry, sector or geographical concentration. Declines in real estate value may take place for a number of reasons including, but are not limited to economic conditions, change in condition of the underlying property or defaults by the borrower.
- All investing involves risk including the potential loss of principal. Market volatility may significantly impact the value of your investments. Recent tariff announcements may add to this volatility, creating additional economic uncertainty and potentially affecting the value of certain investments. Tariffs can impact various sectors differently, leading to changes in market dynamics and investment performance. You should consider these factors when making investment decisions. We recommend consulting with a qualified financial adviser to understand how these risks may affect your portfolio and to develop a strategy that aligns with your financial goals and risk tolerance.
The information contained herein is confidential and the dissemination or distribution to any other person without the prior approval of Fiducient Advisors is strictly prohibited. Information has been obtained from sources believed to be reliable, though not independently verified. Any forecasts are hypothetical and represent future expectations and not actual return volatilities and correlations will differ from forecasts. This report does not represent a specific investment recommendation. The opinions and analysis expressed herein are based on Fiducient Advisor research and professional experience and are expressed as of the date of this report. Please consult with your advisor, attorney and accountant, as appropriate, regarding specific advice. Past performance does not indicate future performance and there is risk of loss.