Private Markets Semi-Annual Update
Key Observations
• The macroeconomic backdrop ended 2025 supportive of M&A activity as evidenced by the number of private equity deals, value of 2025 IPOs and continued capital activity across private markets. This holds true as we enter the early days of 2026 with interest rates modestly lower, financing available and public markets that have remained strong.
• The exit window for venture is as open as it has been for a few years and expectations are quietly high for 2026 as a number of marquee names that garnered substantial valuations in private markets set their sights on public listings. We suggest consistency, not crowding in to remain successful long-term.
• Private debt is in the spotlight, and this year will be an interesting test to see how it handles the pressure. Even if fundamentals and credit risk remain in check, do structural issues start to arise and, if so, how will they be remedied and how will investors respond?
• Real estate is starting to show some overarching signs of stabilizing after capital flow to the space, particularly across traditional property types, which has been anemic for years. Data centers have gathered a lot of interest (and capital), but we caution against over-concentration and duplicating AI themes across every asset class in the portfolio.
• We believe the opportunity for outsized returns in private markets remains substantial, but it is unlikely to be found where the influx of capital is concentrating.
Private markets ended 2025 in a landscape shaped by continued uneven momentum across fundraising, deployment and liquidity. Larger managers continue to attract a growing share of commitments, while smaller firms are navigating longer timelines and tighter LP capital pacing. These patterns reflect limited exit activity, slower distributions and a more cautious approach from allocators. Structural themes like the expansion of AI and digital infrastructure, valuation resets within real estate, and strong demand for asset backed lending are reshaping how capital flows across private markets. Private equity deal activity improved with better financing conditions and renewed interest in larger transactions. Real estate values have begun to stabilize after a difficult rate environment. Private debt continues to grow due to ongoing demand for flexible lending solutions and strong distribution through the private wealth channel. Taken together, these trends create a market where headline challenges and longer cycles coexist with meaningful pockets of opportunity. Said differently, and as we have highlighted historically, WHERE investors are allocating within private markets will determine their outcomes, not IF investors are allocating to private markets. The sections that follow outline how these forces are shaping each segment of private markets and what they imply for investors as they position their private portfolios for the coming year.
Global Fundraising and AUM
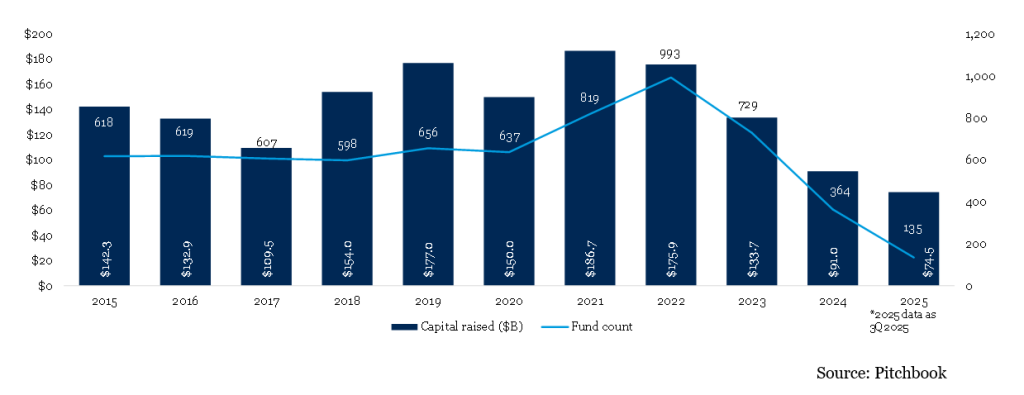
Fundraising today feels less like a steady pipeline and more like a series of coin flips, and most market participants would agree the odds haven’t improved. If the anecdotes aren’t convincing, the numbers should be. Through the first three quarters of 2025, global private capital fundraising totaled roughly $1.25 trillion across 3,372 funds, down more than 20% in value and about 45%in fund count versus the prior four-quarter period, and well below the $1.90 trillion raised at the 2021 peak. Fund count has been hit even harder over this cycle; 2021 saw over 8,400 vehicles close globally, while the trailing four quarters through Q3 2025 barely cleared 3,300, underscoring how sharply the opportunity set has thinned. Venture has historically represented the majority of fund closes – peaking at 54% in 2021 and remaining near 48% in 2025 while North America has consistently dominated by region, averaging 53% over the past five years and reaching ~55% in 2025.
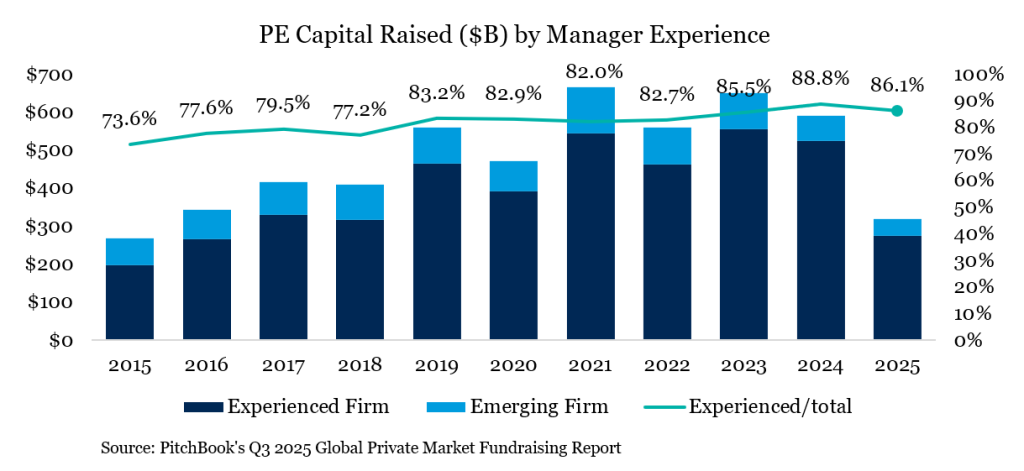
The implication is straightforward: capital is consolidating into fewer, larger hands. Funds over $1 billion now represent on the order of 70–75% of all private capital raised in the last year, and the top five PE vehicles alone accounted for roughly a quarter of PE capital through Q3 2025 – the highest share in over a decade. Anecdotally, it is interesting to see this data pair with conversations amongst LPs. Many investors are attempting to consolidate and simplify their own lineups while at the same time aiming to inject more alpha in the portfolio by looking at smaller funds or more specialist managers. Within strategies like real assets, the skew is even more pronounced, with about 88% of capital in 2025 going to funds larger than $1 billion and more than 65% to vehicles that are at least the fourth in their fund family. Experienced managers similarly dominate across categories such as private equity, real estate and real assets, managers on fund IV+ captured roughly 85-90% of commitments and PE alone saw about 86% of capital go to established platforms by Q3 2025. For emerging managers, the bar to entry has rarely been higher. LPs continue to favor scale, track record and perceived safety, often citing the administrative burden of too many relationships and the recent memory of challenged distributions in their decision to narrow rosters. This is particularly true of newer investors into private markets, of which there are many as access and democratization continue to expand.
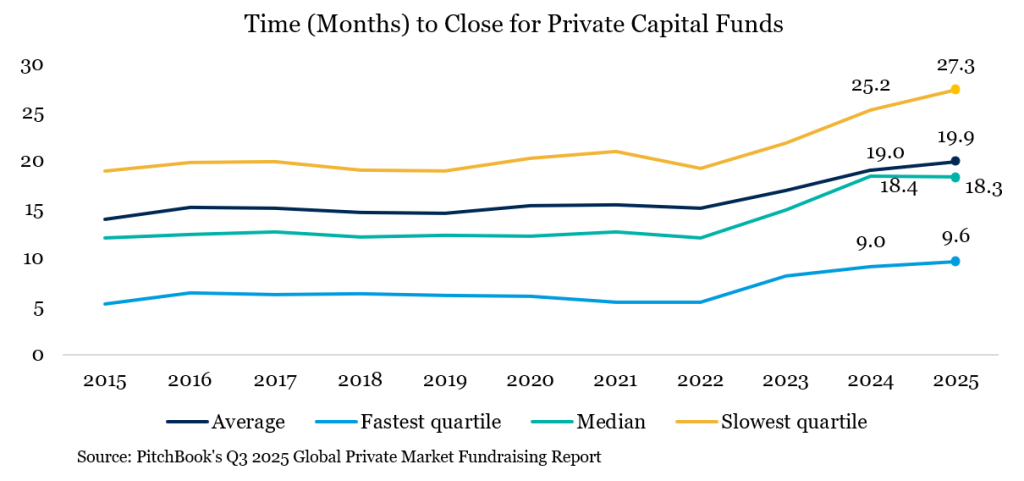
There is no denying the competition for capital remains high, even as more capital concentrates among fewer funds as even those larger funds typically take several quarters to go from start to finish. Where possible, LPs are slowing re-ups and extending diligence cycles, which has pushed fundraising timelines higher almost across the board. In venture, for example, the median time to close has reached a record 17.4 months in 2025 year-to-date, up from just over 10 months in 2022, with the slowest quartile stretching well beyond two years. Fund of fund (“FoF”) vehicles, which often sit downstream of broader allocation decisions, are seeing similar slippage – the median close time approached 20 months in 2025 after hitting a record 21 months in 2024. This competition has put more pressure on GP’s to better understand the demand among their investor base, differentiate from peers and think strategically about how they go about raising capital.
In short, private capital fundraising today is defined by concentration, longer timelines and constrained liquidity. Until exits improve meaningfully, aging dry powder is worked down and LPs regain confidence in the cadence of cash flows, the cycle will remain challenging – with a growing divide between managers who can still close funds in a single, tightly run process and those for whom every dollar feels contested.
Private Equity
In 2025, deal activity value in private equity (buyout, growth equity and turnaround strategies) surpassed $1 trillion for the second time ever, levels not seen since its record year in 2021. Deal value was up approximately 57% from the 2023 low and up 31% over 2024. Deal count growth was up only 6% compared to last year, indicating larger deals made. After a strong and optimistic start to the year, tariff uncertainty put a pause on most deals. The pause ended by the third quarter as activity picked back up in the second half.
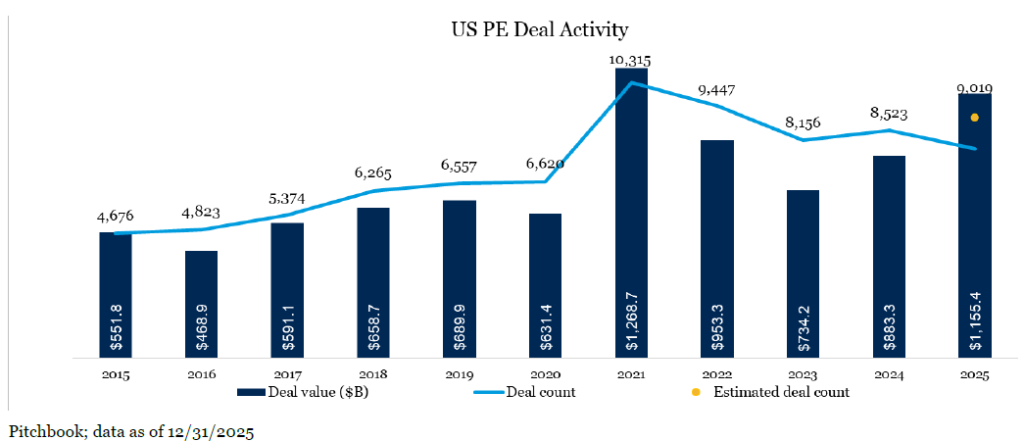
150 megadeals fueled overall deal value growth. Total value of deals over $1 billion was up 90% year over year. This pairs with where capital has been raised recently as funds have gotten larger and more pockets of capital have opened (retail money in evergreen funds, large co-investment demands from LPs). In addition, multiple rate cuts in the US and increased access to financing helped drive these larger deals. Some of the largest deals that helped drive growth were Sycamore Partners’ $23.7 billion acquisition of Walgreens and 3G Capital’s $9.4 billion acquisition of Sketchers. Mega deals also dominated US PE exit value, which rose almost 90% while exit count was up approximately 17%.
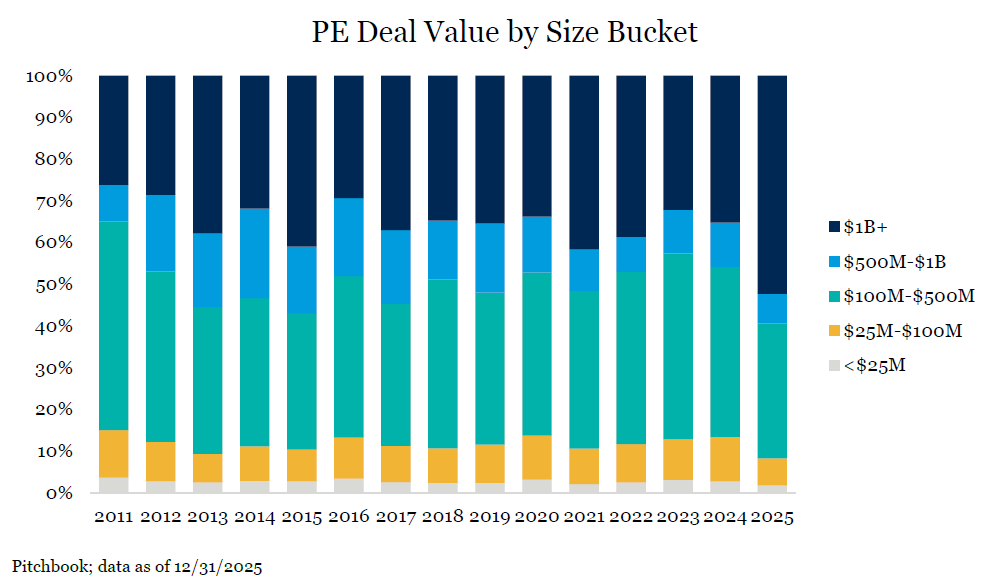
U.S. deal activity when broken out by sector remains relatively unchanged over the past few years with B2B and B2C along with IT continuing to be the lion share. Add-ons continued to dominate the overall transaction activity volume for U.S. buyout activity, approximately 73% which is in line with the past five years. While add-ons are an effective way to grow a business quickly, particularly if organic growth looks meager, they present their own challenges as it pertains to integration. In today’s market, roll-ups that have not sufficiently integrated are facing steeper challenges in the exit market, putting pressure on GPs to do more work. U.S. add-on value is predominately driven by B2B at approximately 46% while other sectors like healthcare and IT make up 12% and 16% respectively.
The trend of businesses at the lower end of the market trading for less relative to the upper end of the market continues with the 2025 median North America and Europe EV/EBITDA multiples of deals $1 billion – $5 billion at 13.2x while deals under $100 million were 7.6x. This dynamic underscores the relative inefficiency at the lower end of the market, creating greater opportunity for managers to generate value through multiple operational and strategic levels while entering at more attractive valuations.
Venture Capital
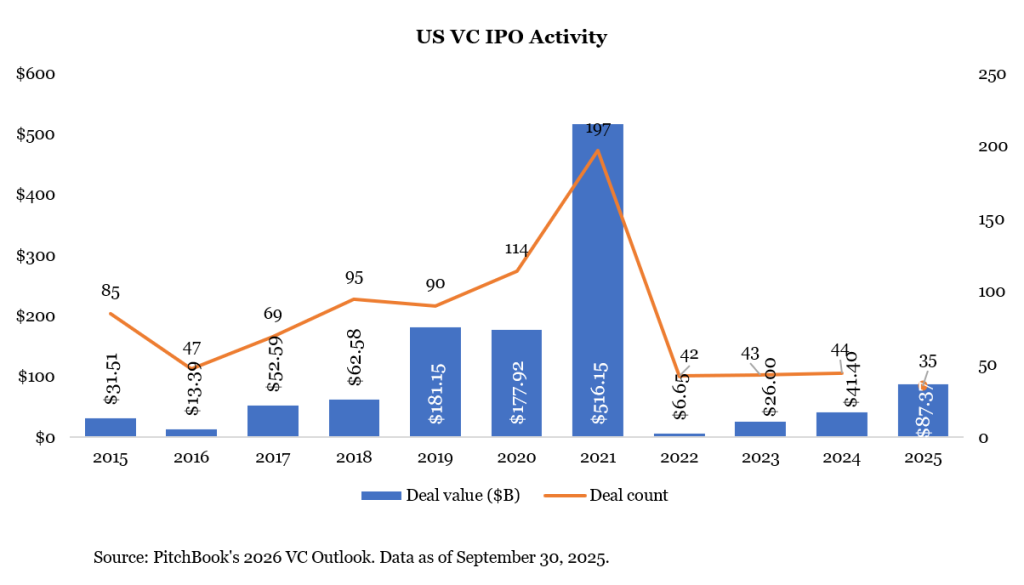
Enthusiasm returned to venture capital in 2025, particularly with anything involving AI. We saw deployment gradually improve across both early‑ and late‑stage rounds even as investors remained highly selective. Deal flow remained well below the peaks of 2020–2021, but capital increasingly concentrated around AI‑aligned companies and other high‑conviction themes, creating a more constructive backdrop than in recent years. Against this environment, and following several years of muted exit activity, conditions for venture‑backed IPOs have also improved. Public equity markets remain near all‑time highs, risk appetite has steadied and interest in durable, growth‑oriented businesses has returned, resulting in a more supportive, though still constrained, setting for venture exits. Still, the IPO window remains narrow; from our perspective, the tone has simply shifted from “closed” to “cautiously open,” with public markets primarily receptive to category leaders with scale, strong revenue visibility and exposure to long‑term secular themes, particularly artificial intelligence.
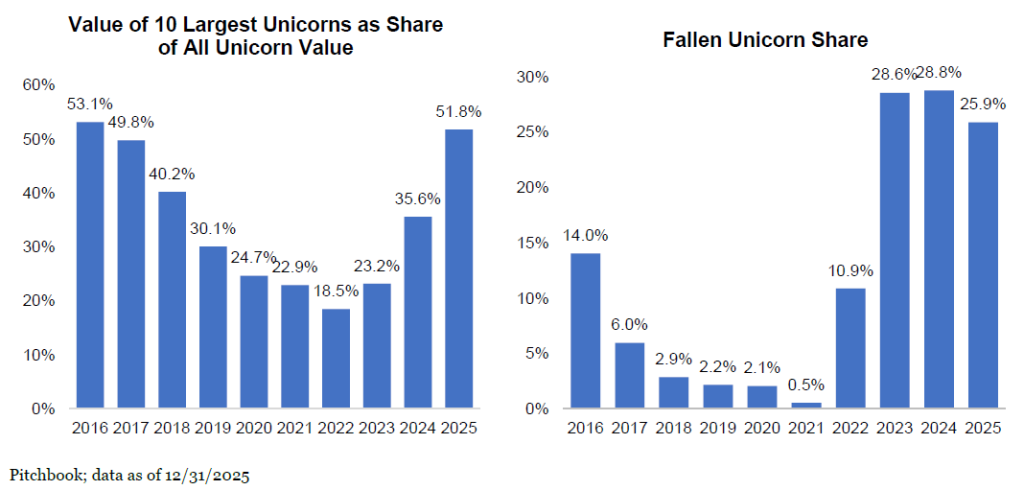
This selectivity has resulted in a bifurcated venture market. At the top end, well‑positioned companies continue to raise large rounds and extend their private lifecycles, supported by deep pools of capital (platform VCs and crossover funds) and strategic investor interest. In contrast, many companies outside of these favored categories are getting less attention, may face valuation pressure and a potentially more challenging path to scale. As a result, venture capital today increasingly resembles a “barbell” market, with capital flowing either to early‑stage innovation or to a small group of mature, category‑leading platforms.
At the same time, signs of a gradual reopening in exit pathways are beginning to emerge. Encouragingly, 2025 provided tangible evidence that public markets are once again willing to absorb high‑quality venture‑backed companies, with successful IPOs from CoreWeave and Circle serving as two examples. While overall IPO volume remained modest, several offerings demonstrated strong investor demand and solid aftermarket performance – even when companies listed below prior private‑market peak valuations. This reset in pricing has been a healthy development, helping to realign expectations between private and public markets.
This dynamic has important implications heading into 2026. A growing number of late‑stage venture‑backed companies are actively preparing for potential public listings, with a short list of large, well‑known names emerging as credible IPO candidates. Figma stands out as a clear example, having already filed an S-1 publicly and serving as a bellwether for enterprise software demand. Beyond Figma, companies such as OpenAI, Anthropic and SpaceX are widely viewed as near‑term IPO candidates given their scale and capital intensity, even if precise timing remains flexible. Additional mature platforms, including Databricks and Canva, are often mentioned in the discussion as part of the broader IPO backlog. While not all these businesses are expected to list in 2026, their increased preparation activity underscores a meaningful reengagement with public markets after a prolonged hiatus. As the boundless enthusiasm returns to venture and companies continue to raise massive sums of money at eye popping valuations, we think now is the time to stay consistent, not ramp up. Windows of broad liquidity do not happen regularly, they could take decades to happen and close very quickly.
Real Assets
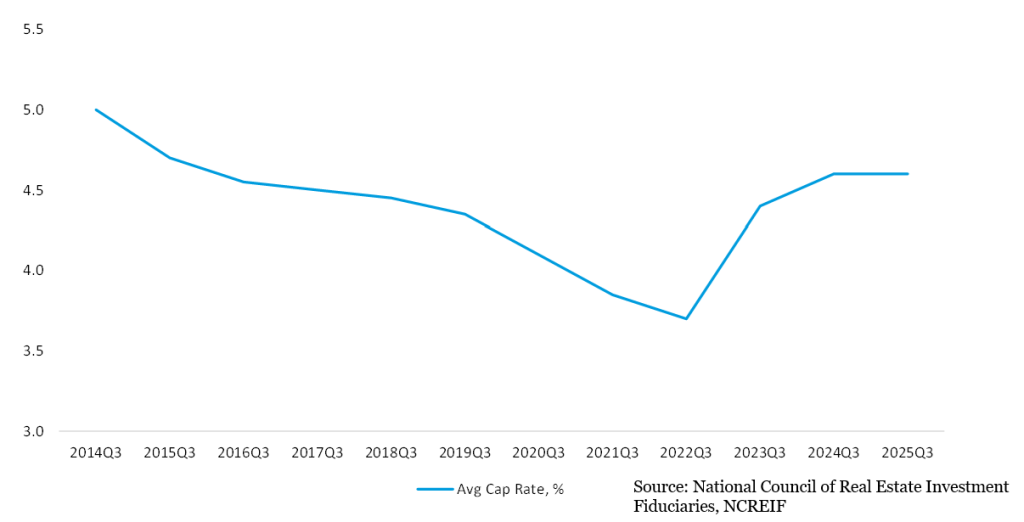
Since peaking in 2021, real estate strategies have continued to face headwinds in both fundraising and performance, as higher interest rates weighed on capital flows and valuation stability. However, through the third quarter of 2025, fundraising activity appears to have stabilized and is tracking similarly with 2024 levels, reflecting cautious optimism among investors about lower prospective interest rates and the recent stabilization in asset values. As shown in the chart below, the National Council of Real Estate Investment Fiduciaries (NCREIF) Property Index (NPI) weighted average cap rate now stands at its highest level in a decade, signaling a more attractive entry point for new real estate capital. Still, a durable recovery will ultimately depend on where interest rates settle and how those levels flow through the broader economy, an economy that is itself reshaping the relative dynamics across real estate subsectors.
Fundraising remained heavily concentrated in the multifamily and industrial sectors, while office, retail and hotel strategies continued to attract minimal new capital. Of the 20 largest North American primary real estate equity funds closed year‑to‑date, 13 have targeted multifamily and/or industrial assets and another three have pursued broadly diversified mandates that explicitly avoid exposure to office, retail and hotel. The diversified vehicles are instead reallocating toward niche sectors such as cold storage, medical office and senior housing, segments underpinned by durable demand drivers and less cyclical revenue profiles. Data centers, in particular, have emerged as a major capital magnet, with four of the 20 largest funds focused exclusively on the sector. However, as valuations rise across these once “niche” areas and capital remains scarce in traditional segments, we continue to favor managers with vertical integration and deep operational expertise with the flexibility to invest across a wider opportunity set, including under‑capitalized sectors where pricing is more compelling and competitive intensity is subdued.
Within real assets, we continue to favor the digital infrastructure segment, where structural tailwinds remain compelling. That said, elevated valuations and the capital‑intensive nature of certain segments require a more nuanced approach. Data centers, while highly sought after, come with meaningful capital intensity, concentration risk and still‑evolving long‑term hold dynamics. Liquidity has also been thinner than one might expect for assets of this scale. As a result, we are prioritizing broader digital infrastructure strategies that maintain exposure to data centers but do so through more structured approaches, alongside opportunities that are also investing across fiber and cell towers. These other digital infrastructure areas offer long‑term growth potential but with less concentrated capital risk and stronger liquidity profiles.
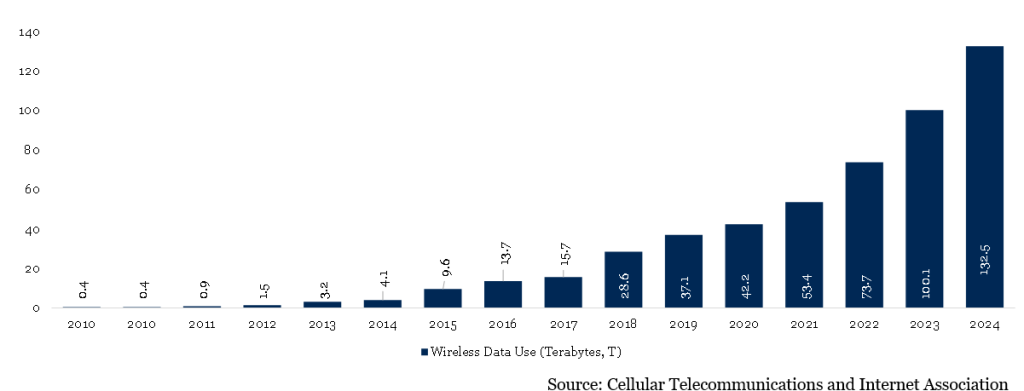
More broadly, the proliferation of AI applications is expected to drive exponential growth in mobile network traffic, reinforcing the need for expanded wireless infrastructure, network capacity and spectrum. Demand for data continues to outpace the capacity of existing wireless networks. As shown below, in North America, mobile data consumption has increased materially. Further, as 5G adoption accelerates, consumers are increasingly reliant on wireless data across daily activities, from at‑home use to transportation, healthcare, manufacturing and other sectors. Finally, as AI adoption rises, mobile network traffic is projected to grow further, increasing demand not only for data centers but also for the broader ecosystem of wireless infrastructure. Given their lower capital intensity, deeper liquidity history and more predictable underwriting, we view cell towers as a particularly attractive sub‑segment within digital infrastructure relative to data centers that draft off these favorable AI macrotrends.
Private Debt
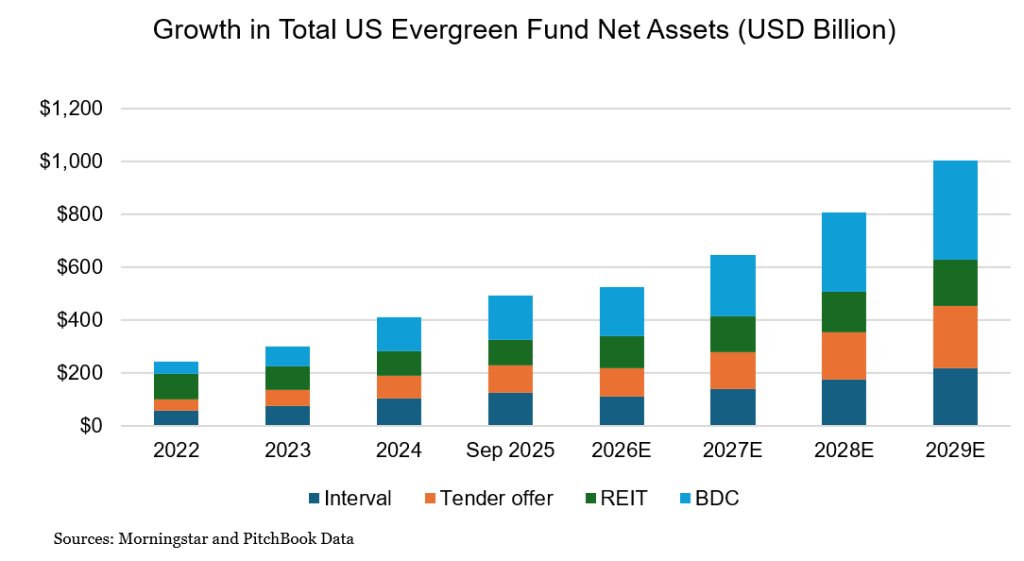
Despite some negative headlines late in the year, private debt maintained strong fundraising momentum in 2025, with a substantial amount of the capital flowing into semi-liquid vehicles such as interval funds and BDCs. These structures, which are primarily distributed through the private wealth channel, now collectively manage approximately $500 billion in net assets, up from just $250 billion in 2022, reflecting their growing role in investor portfolios. While the fundraising remains strong, these relatively new semi-liquid structures are beginning to face their first meaningful liquidity tests, as several of the largest strategies are experiencing quarterly redemption requests at all-time highs.
Alongside continued fundraising strength, deal activity rebounded a bit following a relatively subdued 2024. Moderately lower interest rates helped support an acceleration in M&A activity, with buyout volumes reaching a new annual high of approximately $113 billion, representing a 30% increase over 20241. Despite the increased deal volume, pricing dynamics remain favorable for borrowers with credit spreads remaining compressed.
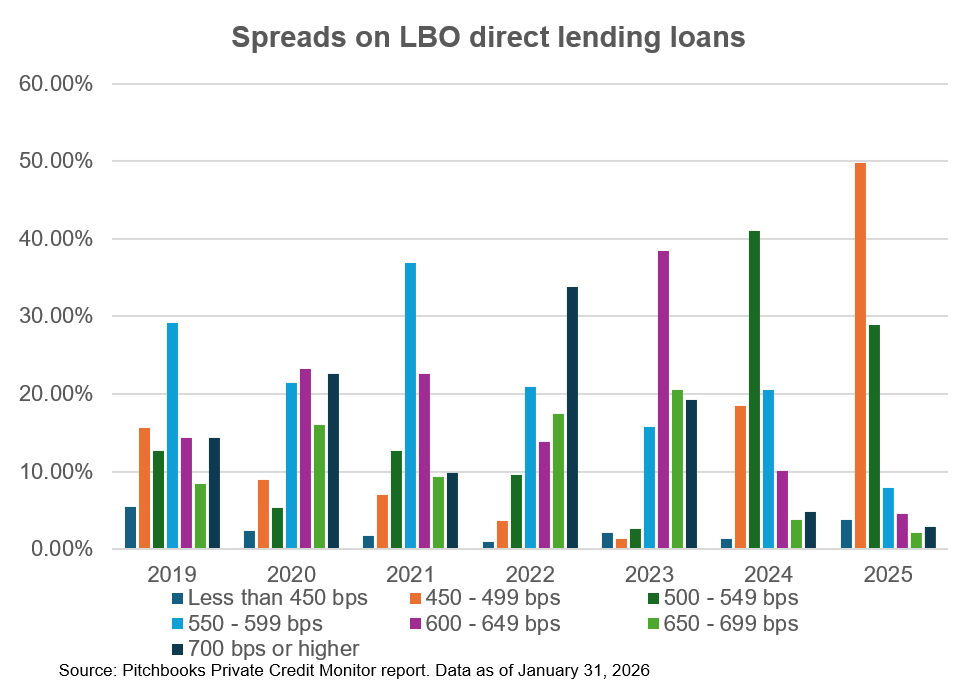
Spreads on more than 50% of LBO direct lending loans were 450-499 bps in 2025, compared to only 18% in that range in 2024. This tightening has been driven by intensifying competition among private lenders, a still‑measured pace of M&A‑driven issuance relative to available capital and renewed competition from the syndicated loan market.
With increased competition for loans, concerns about underlying credit quality and potential software exposure risk, we believe dispersion across different managers will become more apparent. This underscores the importance of manager selection and rigorous underwriting standards, which we believe will play an increasingly important role in driving outcomes going forward.
Finally, investor interest in specialty finance and asset‑backed lending (ABL) strategies continued to build in 2025. These strategies focus on loans supported by specific assets or contracted cash flows such as equipment, receivables, leases or transportation assets – rather than relying primarily on corporate earnings. While aggregate ABL fundraising remains less precisely reported, 2025 saw several multi‑billion‑dollar capital raises, including $6.5 billion raised by KKR and more than $7 billion by PIMCO, reinforcing asset‑backed lending’s emergence as a core and growing segment within private debt.
As private credit markets face headlines, we feel the need to distinguish between the structure risk and the credit risk. From a credit risk standpoint, the magnitude and breadth of defaults still sits well within longer-term averages. We separate that from what we would define as structural risk within many of the semi-liquid funds today. This remains one of the biggest risks as the liquidity of the structure does not match the liquidity of the assets and how the market and investors react to being gated is uncertain and largely untested amongst this asset class and class of investors. Despite this, we believe senior secured debt is the asset class best positioned within an evergreen structure (relative to equity). Investors can take advantage of “Day 1” yield, with returns predominately driven by income (not appreciation), a more stable NAV and ‘self-liquidating’ features as loans naturally come due or are paid off.
Further, we continue to think that the private markets continue to develop as we have seen with a broader expansion into ABL. We expect more fixed income portfolios to incorporate both public and private structures, while maintaining clear distinctions between traditional credit and securitized or asset-backed exposures.
Private markets enter 2026 with continued constraints arising from liquidity, fundraising, and pacing; however, the landscape is far from static. A lot continues to happen in the space with respect to new entrants, more capital raised and broader access. While this can seem like a lot of activity, almost nothing that happens within six, 12 or 18 months matters. The impactful outcomes, those that ultimately drive portfolio performance, develop over four to six years and have a strategic approach that continues to take advantage of that window, we believe will yield significantly better results than trying to play ‘catch up’ to the latest set of headlines. This continues to be the underlying thesis around focusing on WHERE we want to be in the market.
As we think about the size of managers and ultimately the size of portfolio companies, larger managers are capturing most of the capital, but this concentration also creates room for smaller, specialist firms to generate meaningful alpha, especially in areas where scale is less advantageous. Across strategies, the most durable opportunities align with long-term structural demand – not necessarily where the most capital is flowing today. AI and digital infrastructure continue to influence venture capital and real assets; valuation resets are creating more attractive entry points in real estate and private debt remains supported by strong interest in asset-backed lending solutions.
Looking ahead, investors should expect to see continued dispersion between managers and sectors as the combination of selective liquidity, evolving capital flows and the pull of certain macro themes will reward operationally capable managers and more thoughtful manager selection. To learn how these insights may apply to your portfolio, we encourage you to contact the professionals at Fiducient Advisors.
1KBRA Direct Lending Deals (DLD), as cited in U.S. Private Credit Market Newsletter, January 2026 (data as of December 31, 2025)
The information contained herein is confidential and the dissemination or distribution to any other person without the prior approval of Fiducient Advisors is strictly prohibited. Information has been obtained from sources believed to be reliable, though not independently verified. Any forecasts are hypothetical and represent future expectations and not actual return volatilities and correlations will differ from forecasts. This report does not represent a specific investment recommendation. The opinions and analysis expressed herein are based on Fiducient Advisor research and professional experience and are expressed as of the date of this report. Please consult with your advisor, attorney and accountant, as appropriate, regarding specific advice. Past performance does not indicate future performance and there is risk of loss.