Changing interest rate expectations impact markets at the start of the year
Key Observations
• Markets were mixed in January, with U.S. large cap equities leading the way while non-U.S. equities and fixed income produced lackluster returns.
• Market sentiment shifted and optimism on the potential for a soft-landing grew. Expectations for a Federal Reserve rate cut early in 2024 shifted significantly over the course of the month.
• Economic data has delivered above expectations of late, but potential headwinds remain and preparing for rather than predicting a downturn, we believe, is the prudent approach.
Market Recap
The New Year began with mixed results across asset classes. Growing optimism around the potential for a soft-landing, expectations on central bank policy, and turmoil in the Red Sea all had an impact on returns.
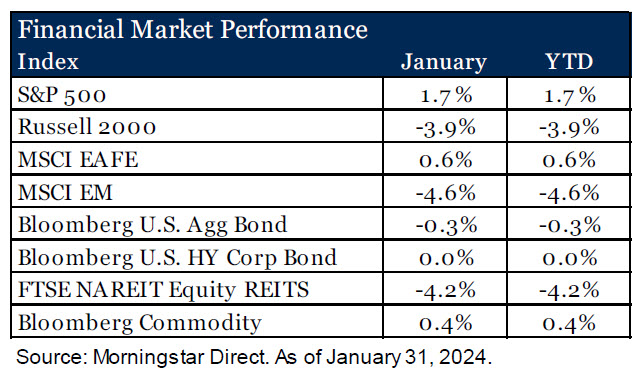
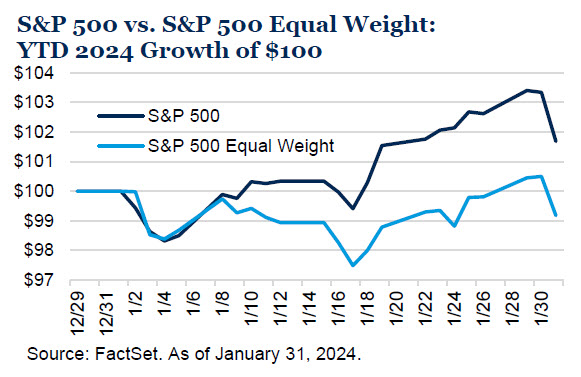
Large cap domestic equities were the winner in January, with the S&P 500 returning 1.7%. The “Magnificent 7” once again helped push the top-heavy S&P 500 Index higher, accounting for over 20% of the return for the month1 and exacerbated the dispersion between the S&P 500’s equal weighted sibling (see chart below). Small cap stocks struggled, with negative returns across almost every sector within the index. Despite the tailwind of more favorable economic conditions, the shift in interest rate expectations was the main drag on the small cap space as investors lowered their outlook for the first rate cut to happen in March.
Abroad, both developed and emerging market equity markets struggled. The U.S. economy continues to grow while neighbors across the pond remain flat. Growth in the European Union was flat in the fourth quarter of 2023, resulting in 0.5% growth for calendar year 2023 across the EU, according to the “first estimate”.2 The developed market focused MSCI EAFE Index gained a modest 0.6% in the first month of the year. In addition to lackluster economic growth, ongoing conflict between Ukraine and Russia and rising tensions in the Middle East and the Red Sea weighed on investor sentiment. Emerging markets, as measured by the MSCI EM Index, returned -4.6%. China, which accounts for over 25% of the benchmark3, continues to be a primary detractor with the country declining 10.6% in January. Anemic economic conditions along with the continued struggle for a debt laden property sector have weighed on investor sentiment. The Chinese government though has not sat idle and has continued to ease lending standards and begun stimulus measures to support economic growth in hopes of restoring animal spirts in markets.
Bond markets took a step back from the strong rally seen in the fourth quarter of 2023, with the Bloomberg U.S. Aggregate Index falling 0.3%. Growing optimism for a soft-landing, shifting expectations for a March interest rate cut, and the heavy issuance calendar of longer dated paper drove the repricing in the fixed income market. The corporate high yield market was flat in the month. The sector is less-interest rate sensitive than the broader market (i.e., lower duration) and spreads ultimately ended the quarter close to where they began.
Diversifying areas of the market such as commodities and REITs struggled as well. The Bloomberg Commodity Index produced a slight positive return (+0.4%). Falling precious metal prices, particularly gold, was a headwind. However higher energy prices helped buoy the asset class as conflict in the Red Sea grew and oil prices rose. REITs traded down on the shift in expectations for rate cuts later in the year after having returned over 16% in Q4 2023 as rate expectations fell. Lower rates reduce lending costs for properties owners, which would be a welcome sign of relief for a market historically reliant on higher levels of debt.
Investor Optimism Growing but Should Still Be Cautious
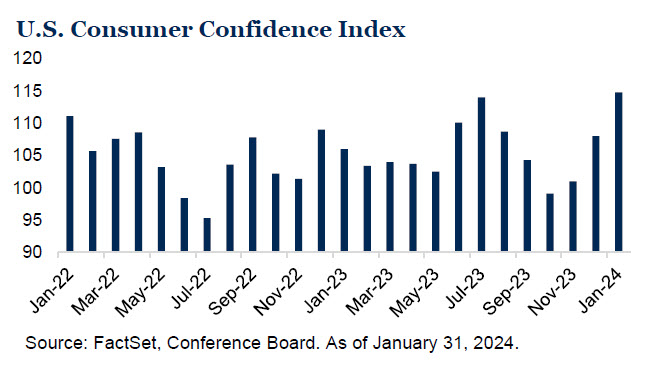
Investor optimism surrounding a soft-landing grew in January. Consumer confidence saw a large jump in the month and now sits at the highest level in the last two years. Not surprisingly, this has coincided with relatively resilient economic data and positive market returns. The U.S. economy showed continued growth in the fourth quarter 2023 as the “advance GDP” estimate reported 3.3%; a strong number, but a sharp drop from the almost 5% growth in the third quarter of last year.4
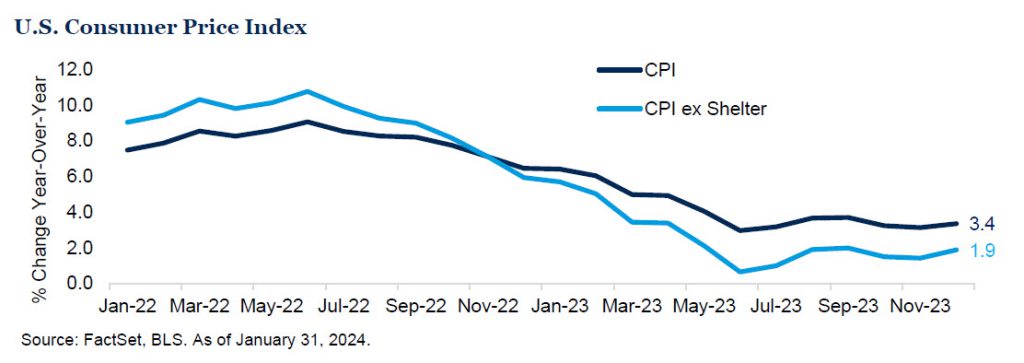
Much of the growth was due to an increase in consumer spending. Inflation, which has been at or near the top of key metrics investors have been watching, continues to moderate. The broadest measure of inflation, U.S. Consumer Price Index (CPI), has trended significantly lower since the start of 2023 and now sits at 3.4% as of December 2023, the most recent reading. While still hovering above the Fed’s 2% target, if we remove the shelter component, which has been persistently high over the past two years, inflation has been at or below 2% since June 2023.5
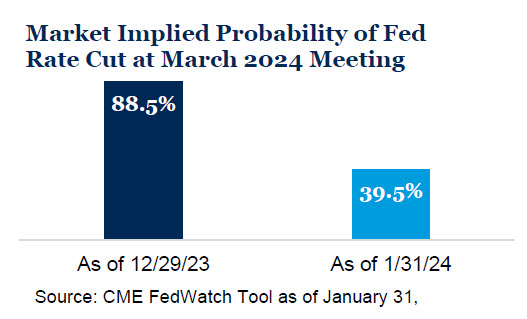
Heading into the end of 2023, investor expectations were widely bullish on a Federal Reserve rate cut in March 2024. However, the resilience of the U.S. economy and favorable data being reported in recent weeks has seen those expectations shift significantly. While moderating inflation has set the stage for potential cuts in the future, the strong economy has softened the expectation. Markets were pricing an over 80% probability of a Fed cut in March as of the end of 2023, and that shifted to just a 40% probability at the end of January. This shift in expectations had a large impact on markets in the month, as discussed above.
Economic data has certainly been better than expectations in recent months, but it does not mean we are in the clear and have avoided a recession all together. Signals, such as negative leading indicators, still restrictive central bank policy and unemployment, while still low, has moved above its 12-month moving average. Additionally, we are seeing signs from the corporate sector that the outlook may not be all rosy. While only a limited number of companies in the S&P 500 have issued earnings guidance for Q1, over half have been negative.6 As we highlighted in our 2024 outlook, Prepare Not Predict, we remain grounded and recognize that economic contractions are a normal course of the market cycle. The market is pricing in a greater than 50% chance that the Fed’s target rate will be over 100 bps lower than the current level by year-end7, implying investors do in fact see the need for potential central bank action to help support the economy.
Outlook
Our investment themes that we outlined heading into 2024 remain in the wake of mixed market performance in January: the “messy middle” inflation range of 2-5%, preparing not predicting recession, and concentrated consequences. The path for interest rates, in our view, is ultimately lower, and coupled with the potential for an economic slowdown in the future supports higher quality duration assets. The pronounced continued outperformance and concentration in U.S. large cap has created imbalances and presents opportunities in other asset classes and backs our belief in constructing long-term oriented diversified portfolios.
1Morningstar Direct. As of January 31, 2024. Magnificent 7 stocks are Amazon, Apple, Alphabet, Meta, Microsoft, NVIDIA, Tesla
2Eurostat. As of January 31, 2024.
3FactSet. As of January 31, 2024.
4BEA. As of January 25, 2024
5BLS. As of January 31, 2024.
6FactSet Earnings Insight, January 26, 2024.
7CME FedWatch Tool. As of January 30, 2024.
Disclosures & Definitions
Comparisons to any indices referenced herein are for illustrative purposes only and are not meant to imply that actual returns or volatility will be similar to the indices. Indices cannot be invested in directly. Unmanaged index returns assume reinvestment of any and all distributions and do not reflect our fees or expenses.
- The S&P 500 is a capitalization-weighted index designed to measure performance of the broad domestic economy through changes in the aggregate market value of 500 stocks representing all major industries.
- The S&P 500 Equal Weight Index (EWI) is the equal-weight version of the widely-used S&P 500. The index includes the same constituents as the capitalization weighted S&P 500, but each company in the S&P 500 EWI is allocated a fixed weight – or 0.2% of the index total at each quarterly rebalance.
- Russell 2000 consists of the 2,000 smallest U.S. companies in the Russell 3000 index.
- MSCI EAFE is an equity index which captures large and mid-cap representation across Developed Markets countries around the world, excluding the U.S. and Canada. The index covers approximately 85% of the free float-adjusted market capitalization in each country.
- MSCI Emerging Markets captures large and mid-cap representation across Emerging Markets countries. The index covers approximately 85% of the free-float adjusted market capitalization in each country.
- Bloomberg U.S. Aggregate Index covers the U.S. investment grade fixed rate bond market, with index components for government and corporate securities, mortgage pass-through securities, and asset-backed securities.
- Bloomberg U.S. Corporate High Yield Index covers the universe of fixed rate, non-investment grade debt. Eurobonds and debt issues from countries designated as emerging markets (sovereign rating of Baa1/BBB+/BBB+ and below using the middle of Moody’s, S&P, and Fitch) are excluded, but Canadian and global bonds (SEC registered) of issuers in non-EMG countries are included.
- FTSE NAREIT Equity REITs Index contains all Equity REITs not designed as Timber REITs or Infrastructure REITs.
- Bloomberg Commodity Index is calculated on an excess return basis and reflects commodity futures price movements. The index rebalances annually weighted 2/3 by trading volume and 1/3 by world production and weight-caps are applied at the commodity, sector and group level for diversification.
Material Risks
- Fixed Income securities are subject to interest rate risks, the risk of default and liquidity risk. U.S. investors exposed to non-U.S. fixed income may also be subject to currency risk and fluctuations.
- Cash may be subject to the loss of principal and over longer periods of time may lose purchasing power due to inflation.
- Domestic Equity can be volatile. The rise or fall in prices take place for a number of reasons including, but not limited to changes to underlying company conditions, sector or industry factors, or other macro events. These may happen quickly and unpredictably.
- International Equity can be volatile. The rise or fall in prices take place for a number of reasons including, but not limited to changes to underlying company conditions, sector or industry impacts, or other macro events. These may happen quickly and unpredictably. International equity allocations may also be impact by currency and/or country specific risks which may result in lower liquidity in some markets.
- Real Assets can be volatile and may include asset segments that may have greater volatility than investment in traditional equity securities. Such volatility could be influenced by a myriad of factors including, but not limited to overall market volatility, changes in interest rates, political and regulatory developments, or other exogenous events like weather or natural disaster.
- Private Real Estate involves higher risk and is suitable only for sophisticated investors. Real estate assets can be volatile and may include unique risks to the asset class like leverage and/or industry, sector or geographical concentration. Declines in real estate value may take place for a number of reasons including, but are not limited to economic conditions, change in condition of the underlying property or defaults by the borrow.
The information contained herein is confidential and the dissemination or distribution to any other person without the prior approval of Fiducient Advisors is strictly prohibited. Information has been obtained from sources believed to be reliable, though not independently verified. Any forecasts are hypothetical and represent future expectations and not actual return volatilities and correlations will differ from forecasts. This report does not represent a specific investment recommendation. The opinions and analysis expressed herein are based on Fiducient Advisor research and professional experience and are expressed as of the date of this report. Please consult with your advisor, attorney and accountant, as appropriate, regarding specific advice. Past performance does not indicate future performance and there is risk of loss.